BUY THE DIP! | Crypto Strategy Notes for the Week of April 27
BUY THE DIP! | Crypto Strategy Notes for the Week of April 27
If you’d rather see this presented in video form, you can view the replay of the live stream I host every Sunday night:
Despite what many of you think, I am NOT a “perma-bear”. In fact, you’d be hard-pressed to find someone who is more bullish on the long term outlook for cryptocurrencies.
In the past few weeks we’ve seen extremely encouraging price action. Last week, I pointed out that Bitcoin is over-extended and due for a correction. After that, it continued to become even more over-extended, but eventually come back to earth. Many altcoins have not yet corrected in a meaningful way and I expect to see this occur in the next few days.
As you can tell from the subject line, after this correction, I expect large price moves UP, so this is one of those times when BUY THE DIP is the way to go.
Bitcoin
The weekly chart is unchanged, and I will not show it here for the sake of brevity. Just like before, I expect Bitcoin to top in the range of $48k to $82k unless $3k is broken.
Daily Chart
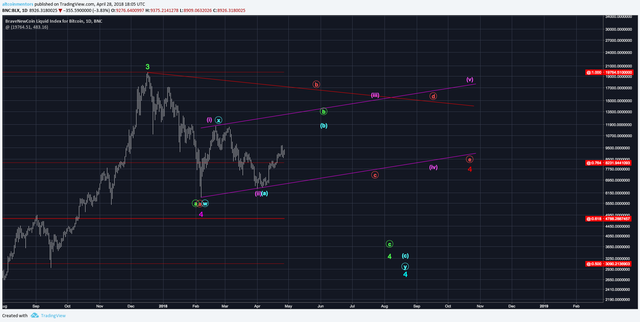
On the daily chart, note that the blue scenario has morphed slightly. It no longer calls for immediate downside, but rather for limited upside and then further downside. The first sign of this will be failure to break the Feb 20 high.
This not to say that breaking below the Feb 5 low before higher highs is not possible. Anything is possible. But it is very unlikely in my opinion.
Out of the four most likely scenarios I have shown, I am favoring the red triangle. This is also the most bullish (self-serving bias may be at play). The reason for this is the extremely strong rallies from alts off of critical supports which means that one more low would be untenable unless we see a major decoupling from Bitcoin, which I also view as unlikely.
6hr Chart
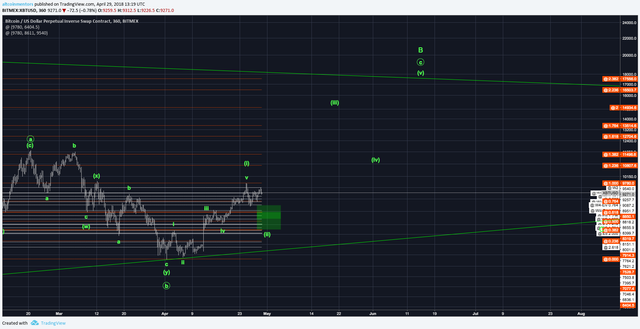
You can see that I’ve switched my intra-day charts to reflect my expectation of the triangle. Part of the reason I view this as the most likely is because of the confluence between time frames. In other words, the expectation in the 6hr price action lines up with the daily expectation.
Wave 1 of c of b of 4 is now behind us and we are in Wave 2. Note that the next wave, Wave 3, is usually the longest and most explosive of the 5-wave impulse structure. These are the ones which you want to trade. More on this in the Strategy section.
90m Chart
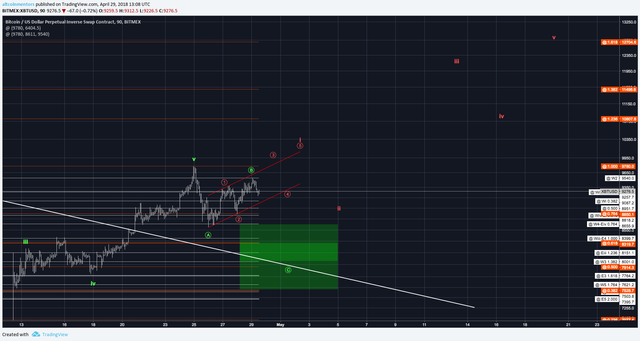
Zooming into the current price action, I view the green path as EXTREMELY likely. It calls for one more low to between $8000 and $8300, possibly down to $7500.
The red path is shown mostly as an academic exercise (I always try to have both bullish and bearish counts on my charts). Green is the standard expectation in Elliott Wave for a correction, but red is a bullish possibility. This structure is called a diagonal and is rare in the equities markets, but fairly common in Bitcoin, hence why it is shown here.
Altcoins
In last week’s strategy notes, I divided altcoins into three broad categories, some having completed patterns, some incomplete. Many of the incompleted patterns have recently completed as Bitcoin went into it’s B-wave, as I noted to expect.
The standard crypto market cycle/fractal is a Bitcoin bull run, then an altcoin bull run as Bitcoin corrects, and then they both correct together. We have just seen large altcoin bull runs and a slight Bitcoin correction. Thus we should expect both of them to correct together. This should not be a large correction like we’ve seen in the past, just one that shakes out some folks before the large wave-3 move up.
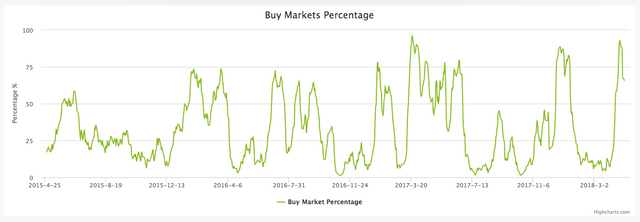
The following is an oscillator of how many altcoin:bitcoin pairs have broken out of their ranges. This is further evidence of where we are in the market cycle. Also note that in the past, we usually see consecutive spikes up (December appears to be an outlier). I expect this percentage to go down to no lower than 50% as we see a small correction and Bitcoin lead in a bull run up to it’s wave 3 target. We should see another spike up as this target is approached and Bitcoin enters wave 4.
Top 6 Altcoins
Strength begets strength. Altcoins that have been strong out of the gate are likely to continue to be strong. Here are the six altcoins that have the highest potential return from their current prices. Though please note that there is generally an inverse correlation between return and probability of outcome.
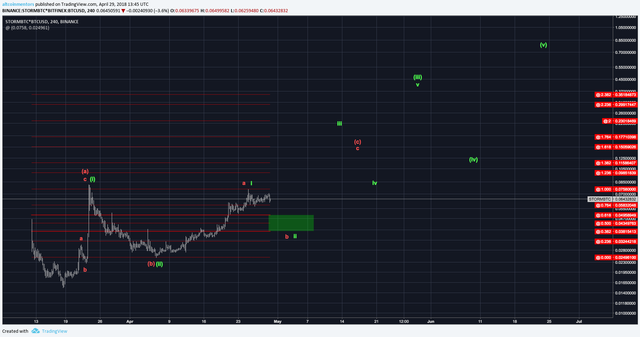
STORM:
- Buy Range: 3.8c to 5c\
- Target: 72c
- Stop Loss: 3c
- Note: We’ll be keeping a close watch because the red abc is a possibility and significantly limits the upside.
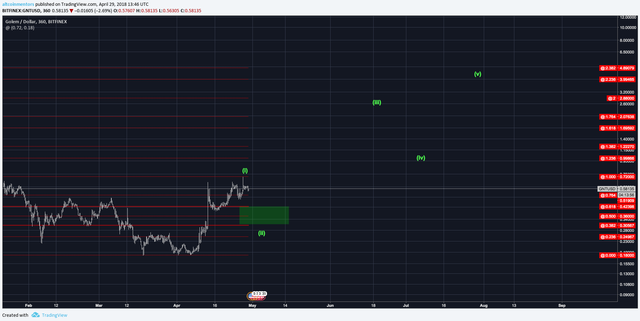
GNT:
- Buy Range: 31c to 42c
- Target: $4.89
- Stop Loss: 23c
![]()
ICX:
- Buy Range: $2.66 to $3.37
- Target: $31.95
- Stop Loss: $2.25
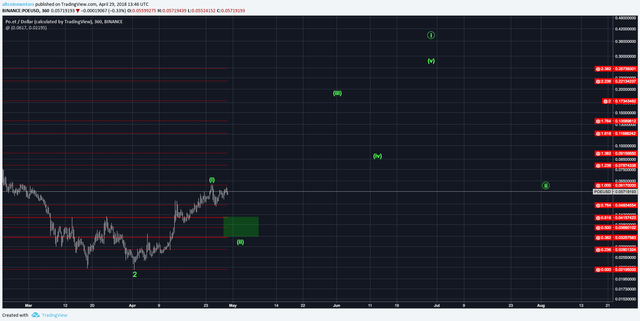
POE:
- Buy Range: 3.2c to 4.2c
- Target: 35c
- Stop Loss: 2.5c
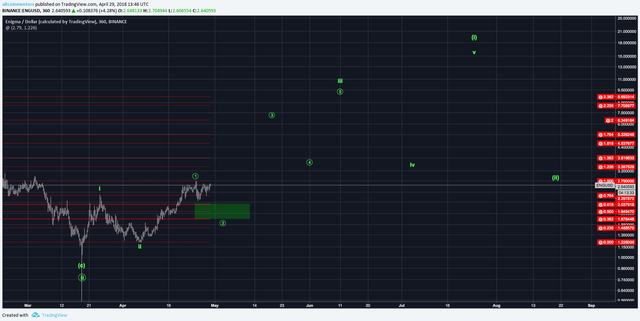
ENG:
- Buy Range: $1.68 to $2.04
- Target: $14.58
- Stop Loss: $1.45
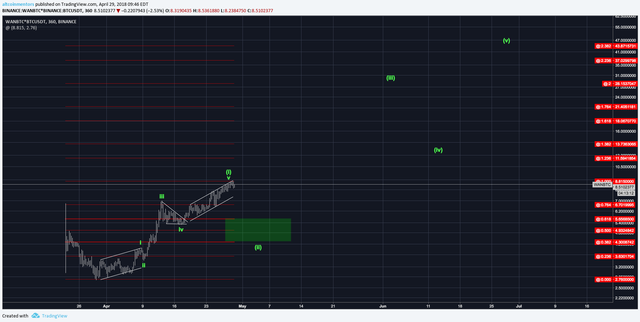
WAN:
- Buy Range: $4.3 to $5.66
- Target: $43.87
- Stop Loss: $3.6
- Note: This one is on a longer time frame. I’m expecting a shallow retrace, and will be scaling in prior to the “optimal” buy range.
These are just the top six of the thirty coins that have the setup I most like to trade. If you want to see the rest, I have a watch list in our model portfolio that you can access immediately by going to https://altcoinmentors.com/portfolio.
Strategy
The strategy this week is to BUY THE DIP.
As I said earlier, we are most likely seeing Wave 2s across the crypto market. Because Wave 3s are the most profitable waves to trade, this retrace is the time to be a buyer.
This is the best buying opportunity for crypto that we have seen in a very, very long time.
You might be tempted to go “all-in” on one or just a few of the coins with the highest potential returns. That would be a mistake. While it would certainly be profitable, the best way to play these altcoin runs is to “rotate” between them.
Start off with a variety (as many as you can effectively keep track of) of coins. Some will pop off before others. Even though those early leaders might not have reached their targets yet, you should rotate those profits into other coins that are earlier in their cycle. The reason to have many coins is because you don’t know which ones will be the leaders.
To get into the weeds more on executing entries, you’ll want to get starter (read: small) positions on the alts that you most like. As they correct, you add more and more size the better price you get. In a market like this, many alts will not get to the bottom of their ranges and thus you may have to wait for the 1-2 of 3 to size up even more.
Always remember to stay patient and let the market come to you. FOMO is a strong emotion, but to be a successful trader, you cannot let it dictate your actions.
If this analysis has been helpful and you want to receive it in your inbox every Sunday, you can sign up at https://altcoinmentors.com/strategy. If you would like to support us, please upvote and share this article with someone else who would find it useful!
To keep up with us during the week, we have a Telegram Channel where we post charts, market updates, and trade ideas every day! You can join by going to https://t.me/altcoinmentors.
We also have a model portfolio that contains all of the moves we are making in the market. You can grab that at https://altcoinmentors.com/portfolio.
Happy trading!
Charlie You
Altcoin Mentors, Inc.