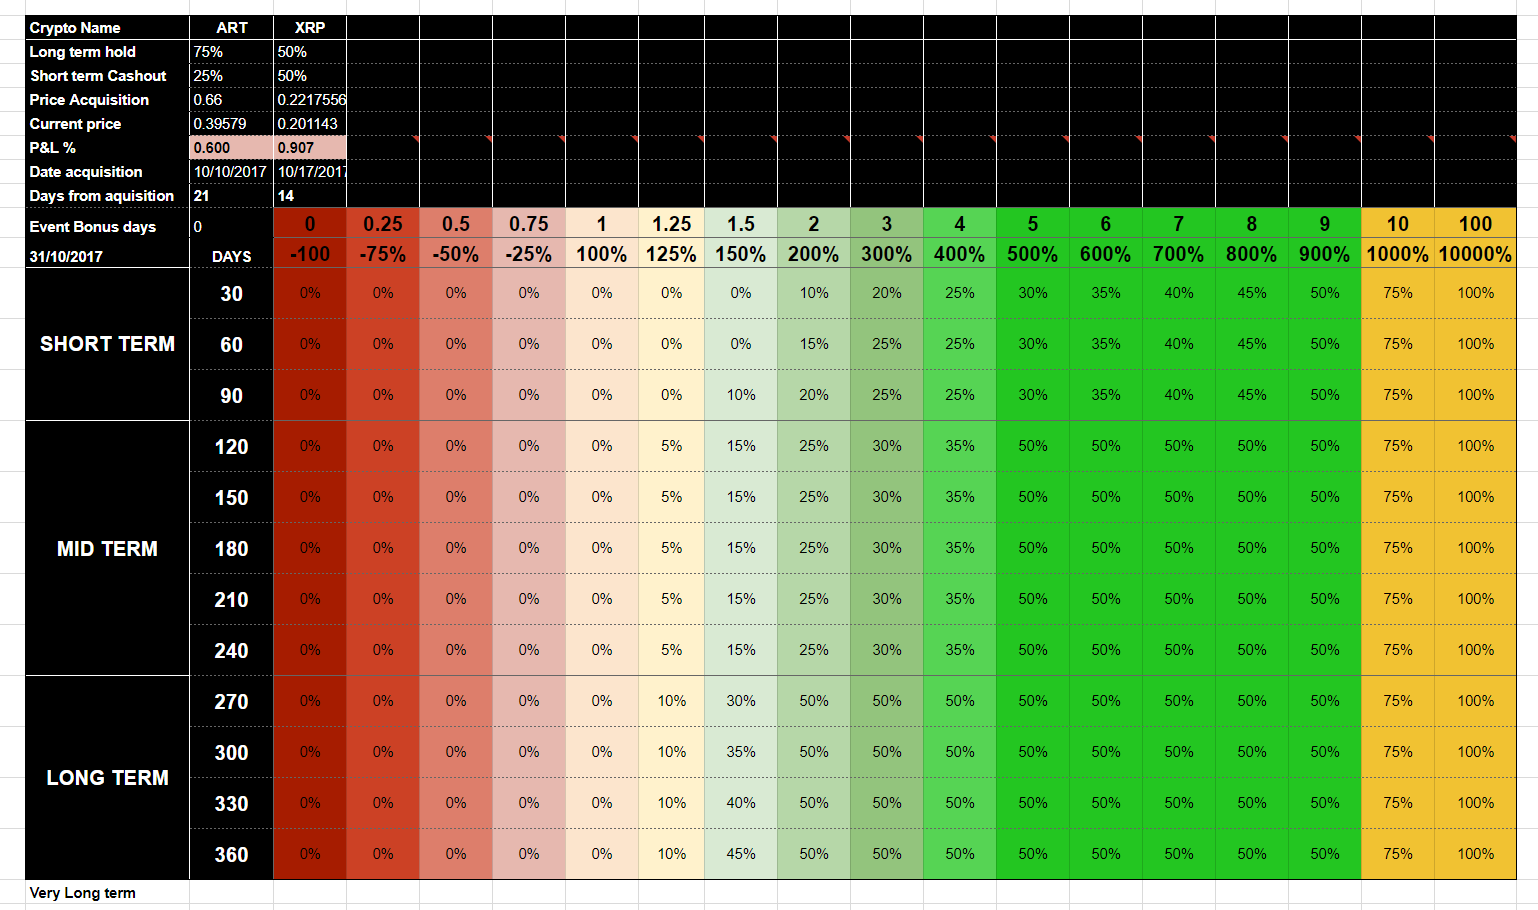
My Cashout/ Hold Crypto Chart
My Cash out / Hold Crypto Chart
Here is a chart I have just created in order to Keep track of my Crypto investment.
It simply allows me to know how much to cash out and when.

INFO 1: All the cryptos I invest in will be listed in the table on the upper level.
INFO 2: The current price is synchronized in real time.
INFO 3: Profit & Loss from -100% to +10000%
INFO 4:Time Short-term (0-90 days) Middle term (90-270 days) Long-term (Over 270 days)
INFO 5: Days from Acquisition shows how many days since you bought your Cryptos
INFO 6 - The most important:
All the % represent the % I am willing to Cash Out at which moment. This is my based on my own strategy. And this can vary completely regarding your objectives.
--> Does it mean that I will exactly allocate the exact % to cash out?
NO!
--> It is a simple indicator, to follow or ignore.
--> Cashing out will depend on the market at the time, the trends, the evolution of the project, the need for cash to reinvest in other maybe more promising cryptos, etc etc..
For 2017-2018 my 3 main rules are:
- Cash out 25% short term when ROI = X4
- Always keep 50% Long-term (Over 1 year)
- Cash out 75% or 100% when ROI > X10 obviously
Any comment? Question? Want to improve it? Download it?
--> Just hit reply <--