How To Make $30 in 30 Minutes Trading Crypto
Good afternoon Steemians!
I hope you all got some good discount buys in yesterday as the Crypto market took a nice big healthy dump and hopefully you didn't liquidate your portfolio out of fear, it was indeed a little bloodbath but that is a GOOD THING. If you're trading smart and doing your research, its all good and nothing to worry about.
If you're like me, you actually welcome a crypto shake down here and there as a nice increase in volatility. After all, the past month has been kind of slow and if you're a long term hodler you were probably starting to get bored.
In light of the recent volitality I'd like to share one of my favorite little tips for making quick gains with ease and (almost) 100% certainty and that is by using the DEPTH CHART.
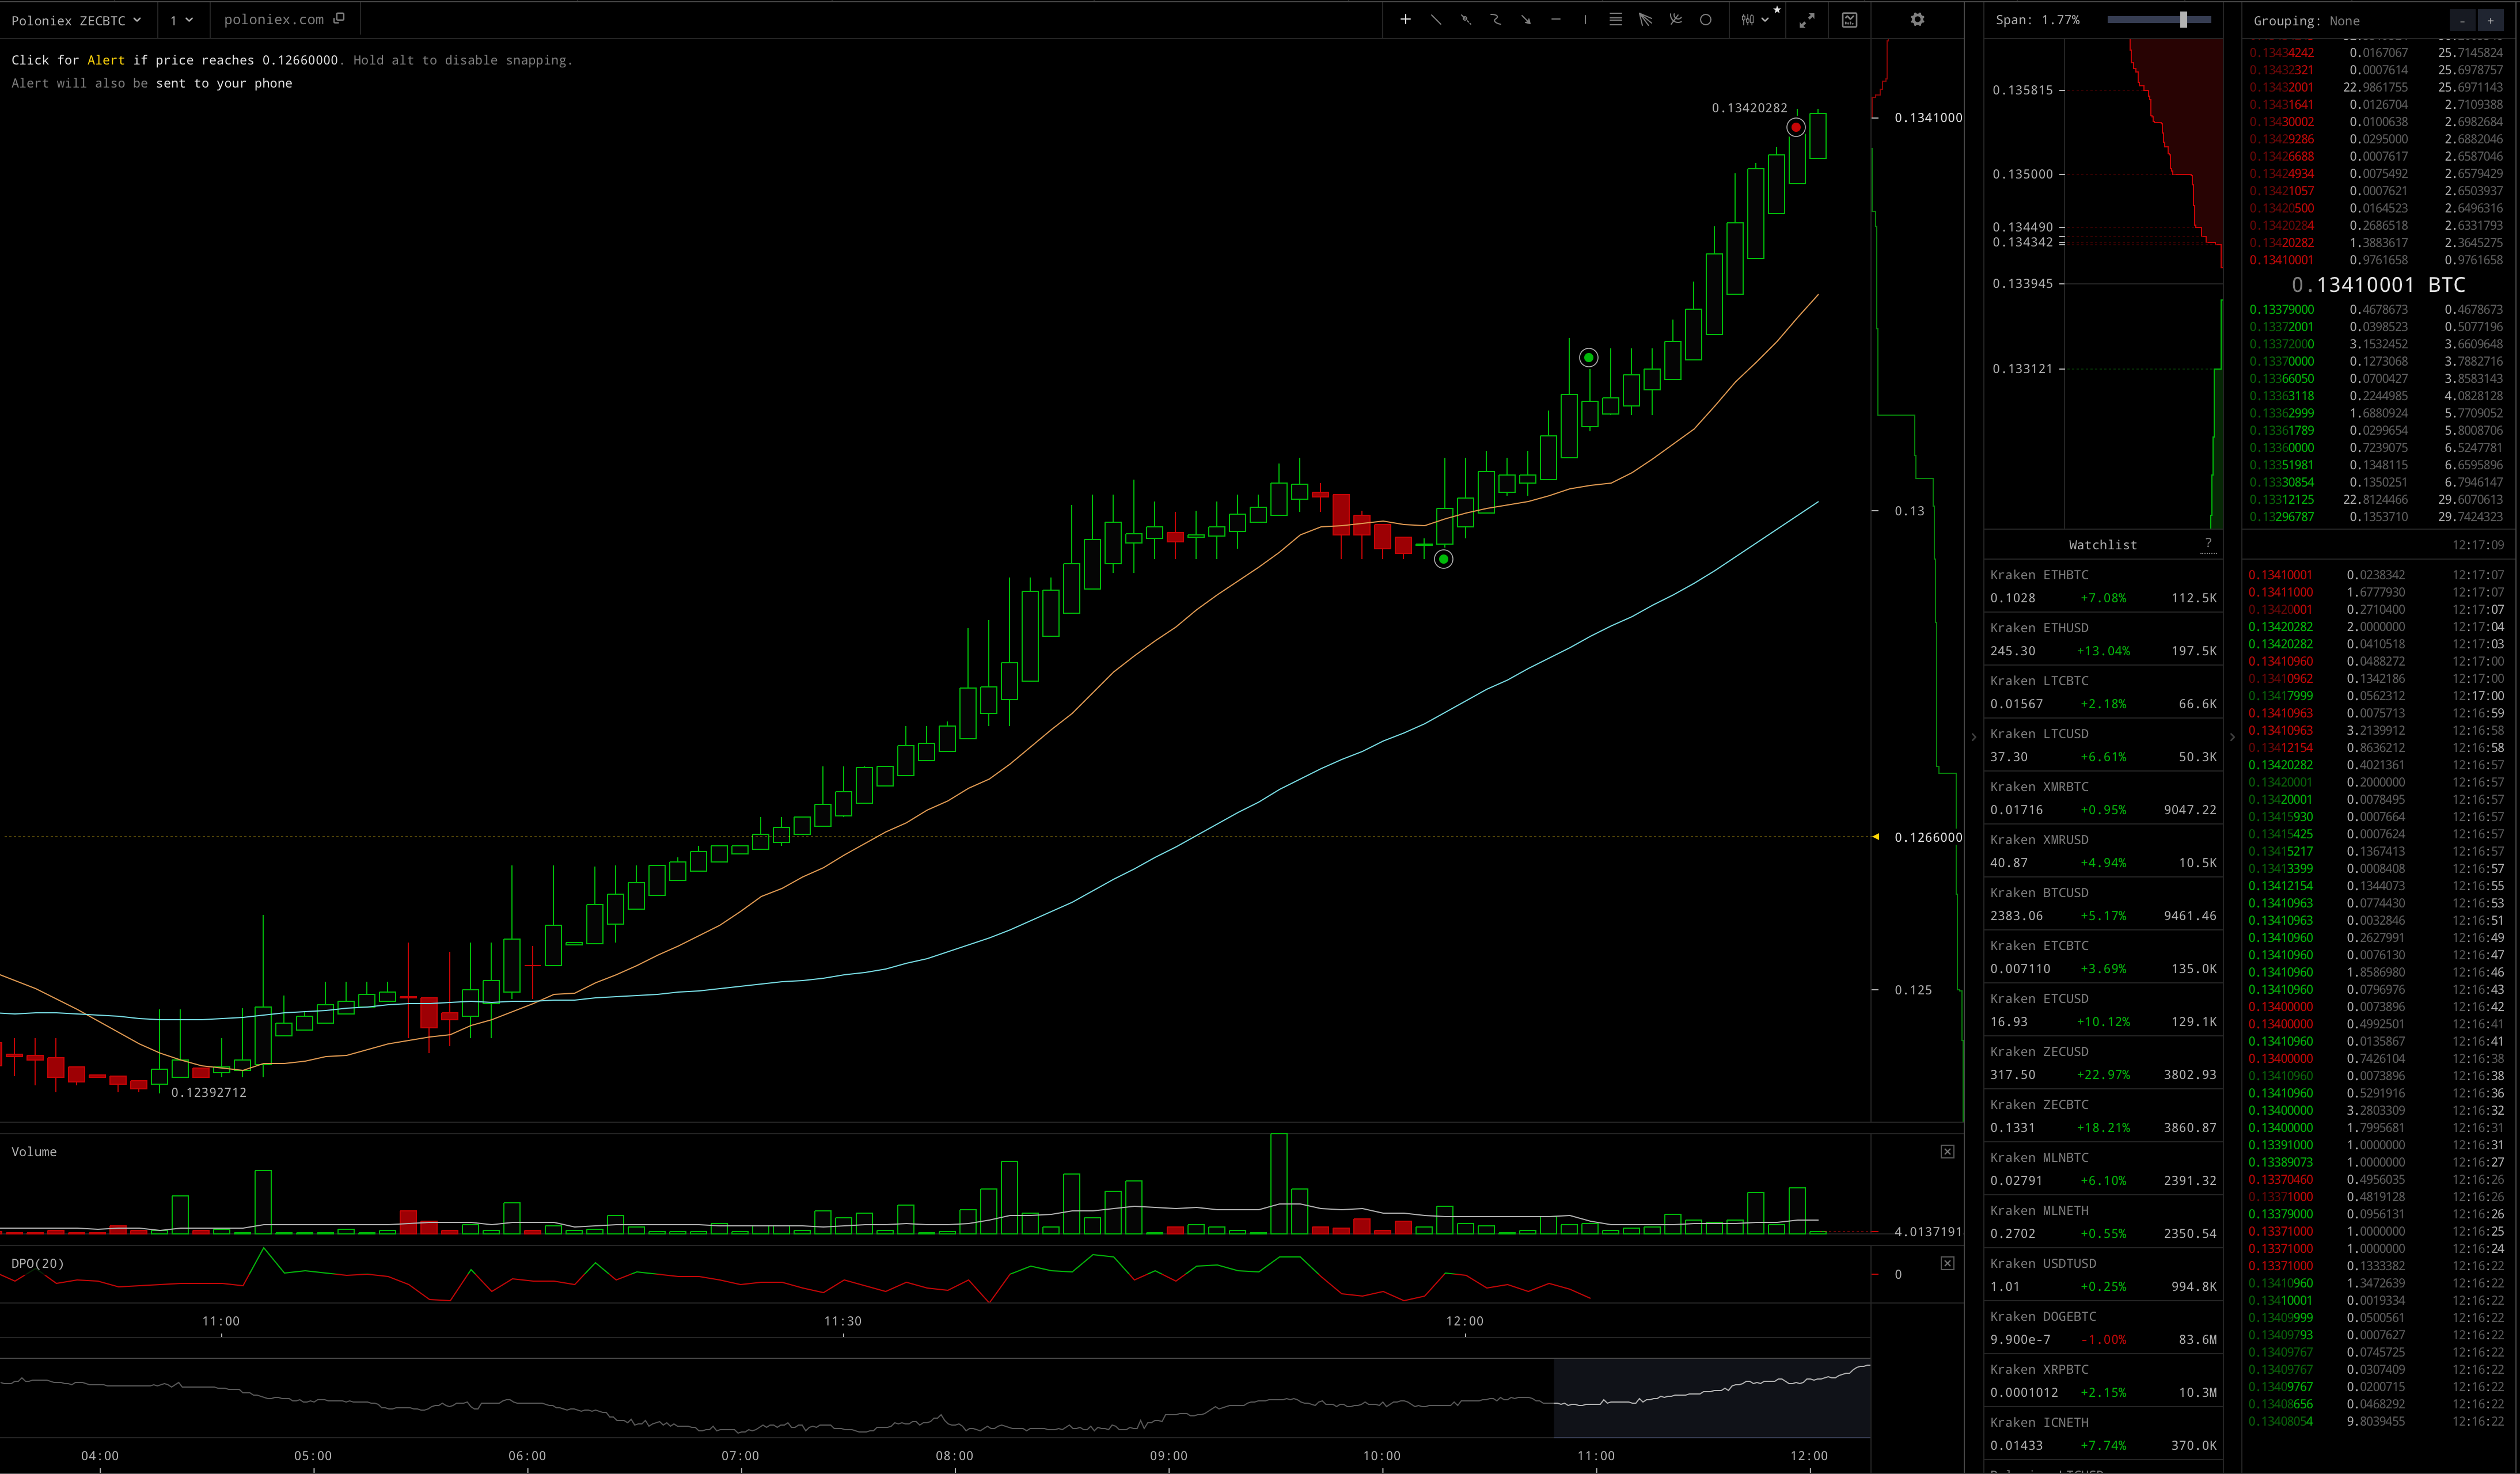
A few hours ago, I noticed a little breakout start to take place trading ZEC/BTC on Poloniex. Naturally, I jumped right into Cryptowatch to take a look at the real time depth chart.
As you can see in the screen shot above, I made a buy at the bottom of the dip (green dots), increased my position shortly after to about .5 BTC and sold (red dots) at a high, walking away with a quick & easy $30 profit.
How did I do this?
I based my buy and sell points purely on the data from the real-time depth chart in Cryptowatch.
How to read the DEPTH CHART?
Im going to keep this very quick, simple and ELI5 as possible. The Depth Chart is one of the most invaluable tools, especially when day trading in highly volatile conditions. If you're unfamiliar with it or trading in general, to wrap your head around it you must first turn your brain off as this is a visual representation of the current state (sentiment) of the market and all the numbers are crunched for you into a pretty little chart so you don't need to think analytically.

First, it is important to understand what this chart means.
The top portion in RED represents all the current sell orders for a particular coin pairing (pictured is ZEC/BTC) also known as the BULLS. The green shows us every open BUY order (the BEARS). In essence, the BULLS want higher prices and the BEARS want lower prices (if you want to buy at a lower than market price, you are a BEAR if you want to sell at a higher price, you're a BULL).
Where the red section meets the green section lands our market price, this is the average of all buy and sells. Market orders will execute at that current price.
How Does This Help Me?
By keeping a close eye on the depth chart, you can get very accurate indications on short term price movements (this is most effective on the 1 - 5 minute charts, 1 minute being the best, 99% of the time I trade only on the 1 min chart).
Before I continue, you must understand how the market works and what makes prices move. In the most simplest terms, if there are more BUYERS than sellers, the price will move UP. Conversely, if there are more SELLERS than buyers, the price will go down. This is better known as Supply & Demand, you must be able to fully understand this concept, it is simple though most novice traders don't even fully appreciate or analyze this data properly.
To expand on this, if there are 100 sellers and only 50 buyers in a given price range. The sellers must compete with each other and lower their prices to attract a buyer (or not sell at all). This drives the market price DOWN. Now if there are 100 buyers and only 50 sellers in this range, the BUYERS must compete with each other and raise their BID if they wish to buy ultimately pushing the market price UPWARDS.
Make sense?
Now REALLY, how does this help me?
Now for the fun part and back to the depth chart.
Take a look at my screen shot and notice where I sold and then look at the depth chart to the right. Within a few minutes, the RED section began to outweigh the GREEN section, meaning at that price we hit a wall with significantly more sellers than buyers. This was a clear indication to me the the price would reverse and start to move down and so I sold netting me a nice, quick profit. Notice where I placed my first buy order, perfectly aligned with the bottom of the last dip. At that time, the buying pressure (GREEN section) built up and outweighed the RED, indicating more buyers than sellers (which made the price continue shoot upwards).
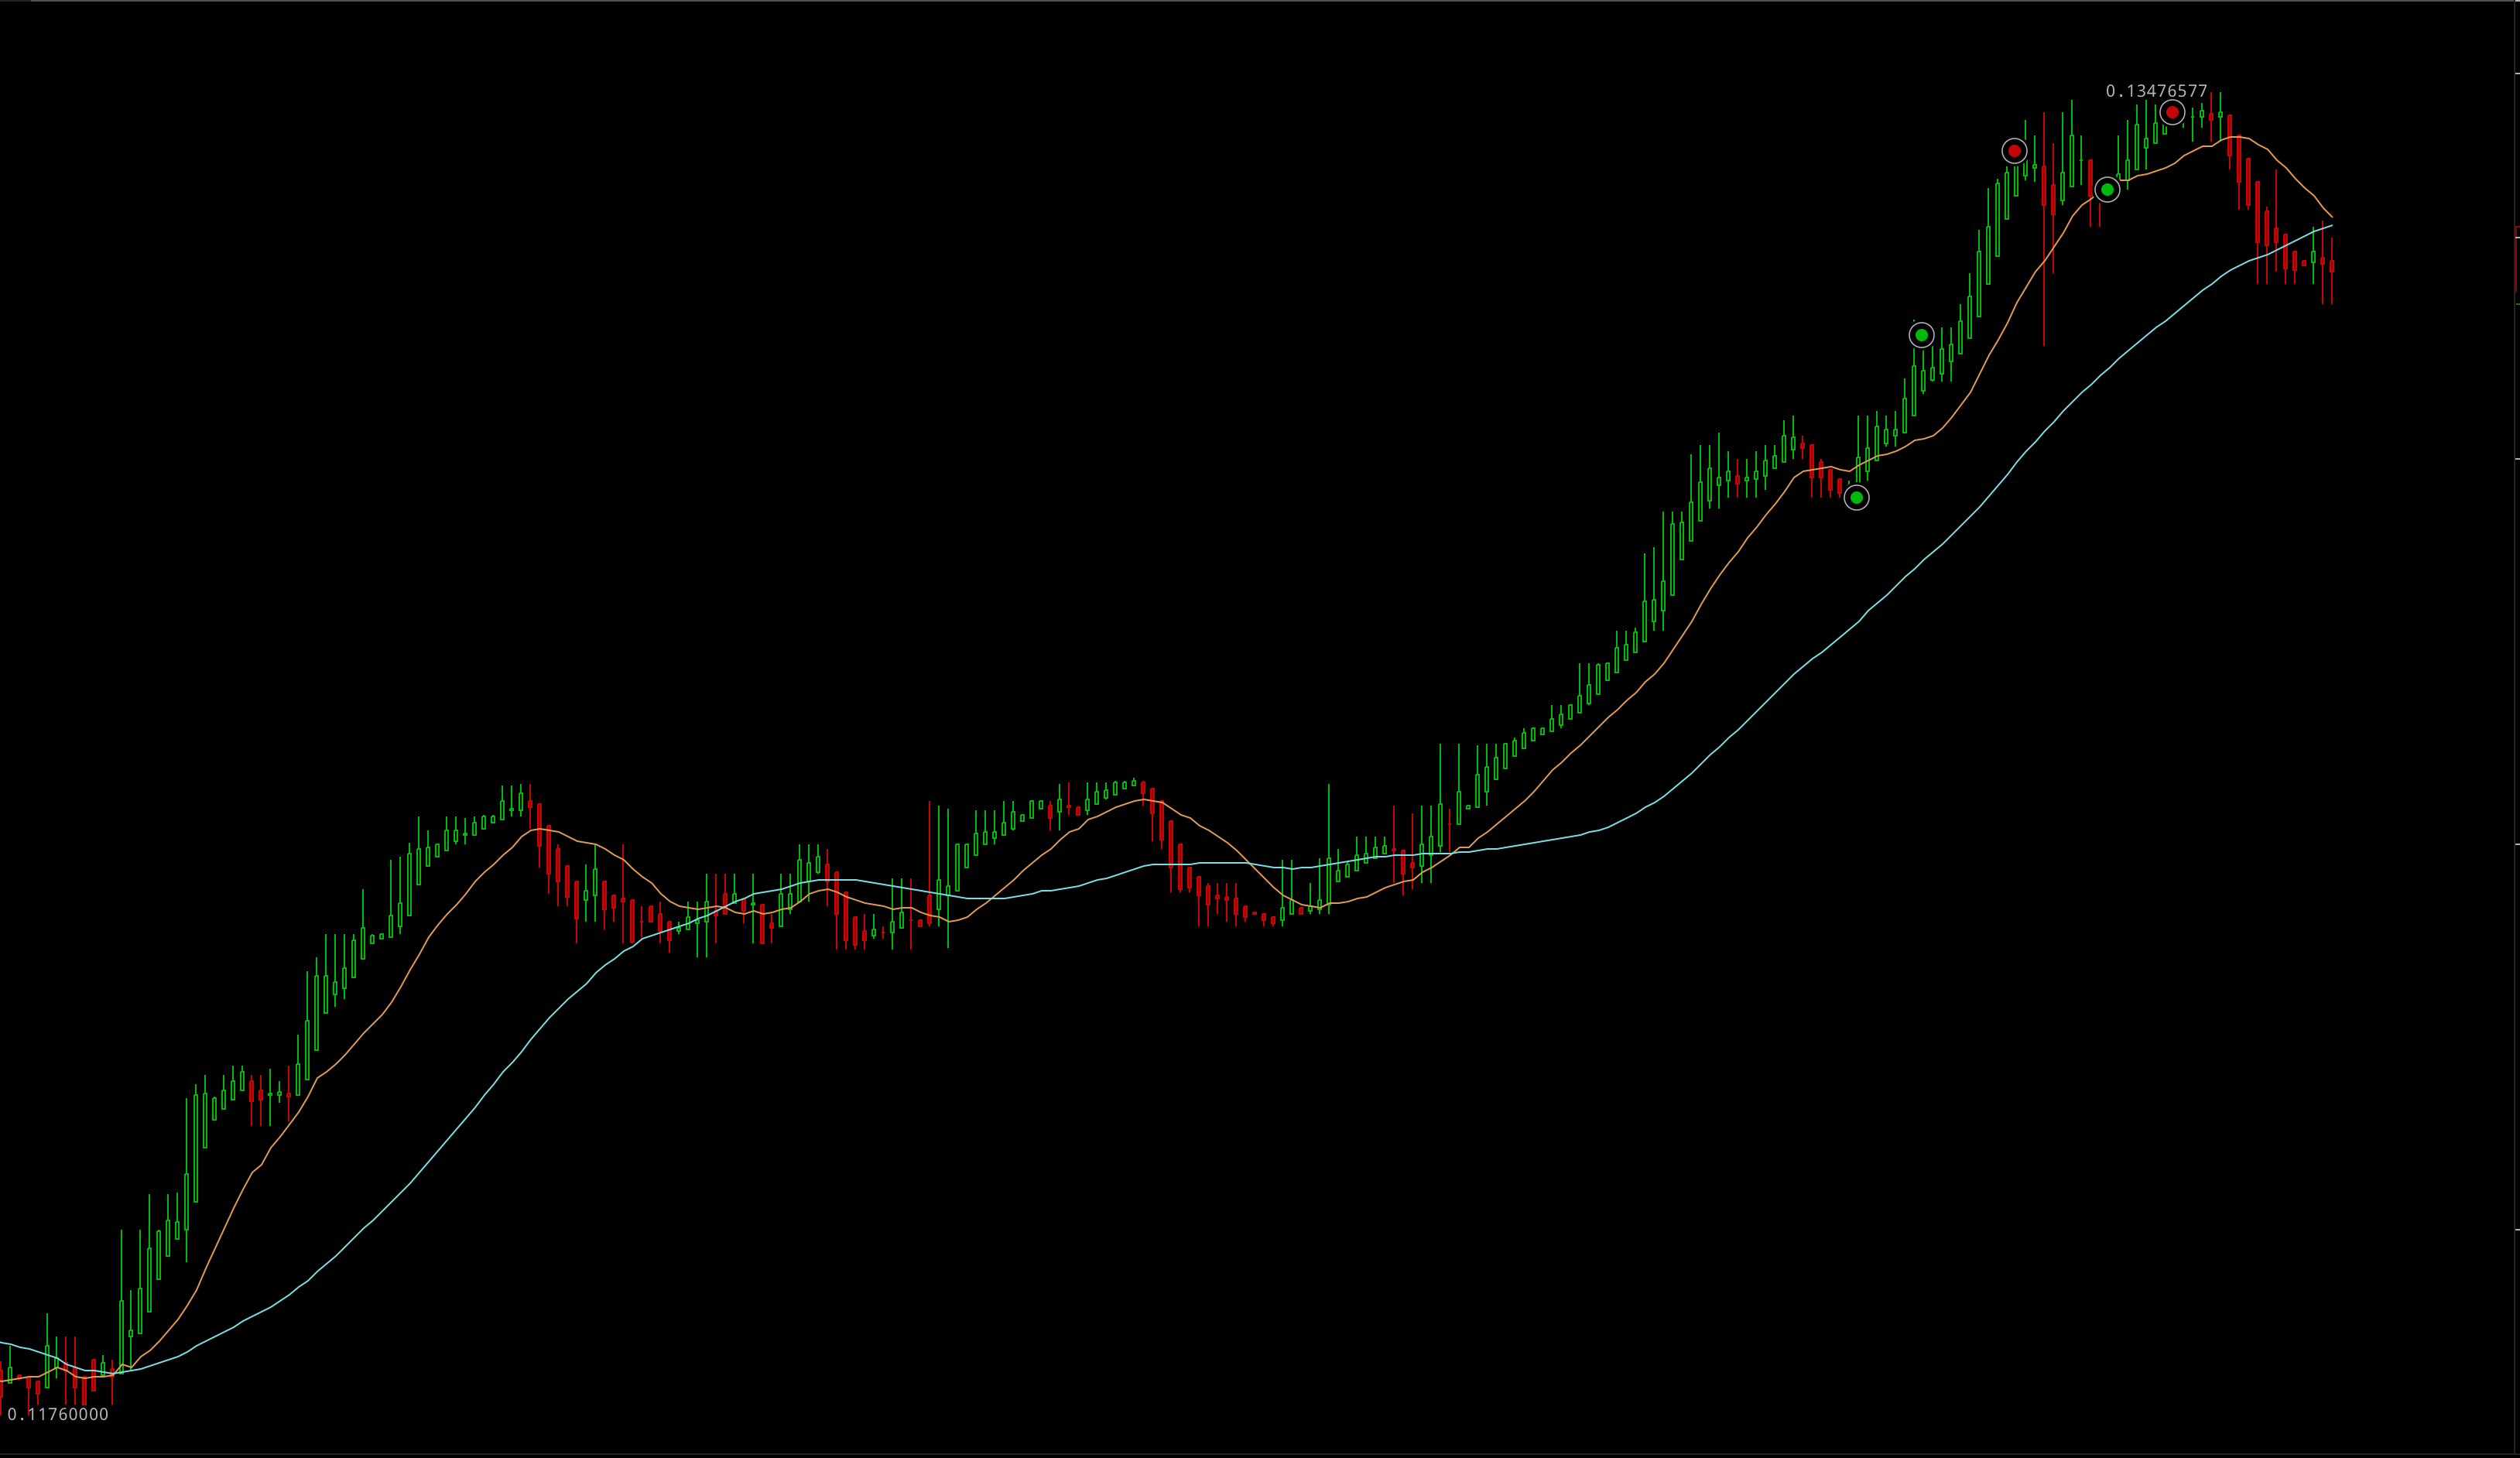
As you can see below, the price did dip a little bit as the buy/sell pressure continued to fluctuate so I made another buy but bailed shortly after (still making a slight profit) and sure enough the price reversed.
I would have continued riding this wave but I wasn't prepared to start trading yet and had my 2 year-old begging to watch paw patrol but hopefully this gives you some new insight into a common tool a lot of people overlook or don't quite understand. I'd love to dive in deeper into reading the Depth Chart if anyone is interested or has any questions, just leave a comment!
Thanks for reading and happy trading!
Great post my friend.
Please follow back.
blogs of mine:
An Amazing rare double headed dolphin caught with a horror end
shares for every citizens of Alaska
Publicly-listed blockchain technology stocks top 3
How to change from feeling worthless to making a change
one of my most heartbreaking moments with a refugee child in Iraq
Thanks!
Congratulations @bitcoinbandit! You have completed some achievement on Steemit and have been rewarded with new badge(s) :
Click on any badge to view your own Board of Honnor on SteemitBoard.
For more information about SteemitBoard, click here
If you no longer want to receive notifications, reply to this comment with the word
STOPBy upvoting this notification, you can help all Steemit users. Learn how here!
Commented on one of your other posts, I'd love more in-depth 1 on 1 training essentially. I'm not wealthy, I'm just a 23 year old playing with $1,000, but I will pay you what I can!