Cryptos to buy in bad times: A spark ⚡in the dark
It's always feels bittersweet to me when I correctly predict a bearish trend
It's a good feeling to call the market correctly, especially if you've predicted it a long way off; but knowing that your investments are losing value is not something that anyone enjoys.
Not too long ago, I wrote a rather important post. It explored the idea that the coins which are first out of the gate in a bullish market, may be those that would perform the best throughout the bull run. This is because investors would expect them to do well, with the result that they would be bought rapidly as soon as money started to flow into cryptocurrencies.
This post is based on the same sort of logic. We are now (I believe) moving out of a sideways period and into a bearish phase back down to around the $6k BTC mark. I believe that this period should be followed by a good bull market or two, which is very important. I want to attempt to use the price movement information available now to determine which coins to buy while they are still cheap. The idea is that when the bull market does arrive, I will already be holding the coins which will perform the best.
High Voltage Spark by corvintaurus ; from DeviantArt https://www.deviantart.com/corvintaurus/art/High-Voltage-Spark-189985132
Cryptos to buy in bad times: A spark ⚡in the dark
My objective is once again to identify the coins that will do well in an upcoming bull market. This will wlso serve as confirmation for coins I may previously have identified as being "first out of the gate" as mentioned above. I want to identify those high fliers that will earn me good ROI when the markets turn positive in earnest.
How do I do this?
Easier than you may think. The most amateur of traders should be able to accomplish the basics with nothing more than the default page coinmarketcap.com and literally only a minute of time!
Look at the BTC chart today. Not looking too wonderful, is it? Look at ETH, XRP, BCH, EOS, LTC etc. All dropping. Looking at the Total Market Cap chart will show you the same thing: a bearish market sliding towards lower price levels.
@tradergurl once wrote that the best way to see what a market is doing is to get a child to look at the chart and then ask them: "Is the line going up or down?", which makes sense to me. It's all too easy to kid yourself into seeing what you want to see instead of what's really there. I often interpret a tiny upwards price movement to mean more than it should; be careful to avoid making that mistake!
Open https://coinmarketcap.com - right to the homepage. I generally work with two sets of coins, the Top 100 as seen on the homepage, and my Watchlist, which is a list of the coins I hold (at least those which are listed on CMC). Let's work with the Top 100 for now.
Looking at the list we can always see the 24h % change. It is vital that you realise how insignificant this figure is! Because of price dips and spikes (especially with lower market cap coins), this figure can have little to no reflection of the true current price trend of a coin. In fact, it often says the opposite! I'll show you what I mean shortly.
Even the 7 day % change can be misleading for similar reasons (though it is a better indicator than the 24h %). So what do you look at? What's quick and easy and works for any coins within seconds?
Sparklines
Those tiny little weekly charts next to each coin on CMC have a name: that name is "Sparklines".
A sparkline is a very small line chart, typically drawn without axes or coordinates. It presents the general shape of the variation (typically over time) in some measurement, such as temperature or stock market price, in a simple and highly condensed way.
~ https://en.wikipedia.org/wiki/Sparkline
That is exactly what we need: "general shape", "simple" and "condensed". I've said it before and I'll say it many more times: a good trader/analyst can eyeball a chart without any need for tools and indicators. These little sparklines are perfect for eyeballing.
It's slightly off-topic, but with very little practise you will even see that you can do slightly more TA with them than just trend spotting. I often use them to detect short-term cup-and-handles patterns, ascending / descending wedges and resistance / support levels. They lack the detail for much more than that.
What I do is I scroll, first through the Top 100 and then through my Watchlist. I'm looking at the sparklines to pick out - with my best "childlike-eye" - those that are bucking the trend. I'm looking for lines that point up and not down.
The first one that catches me is Tether; every time! 😂 (Tether generally points slightly upward in a bearish market.) One day I won't fall for the Tether trick. One day...
Let's look at a few examples from today's chart:
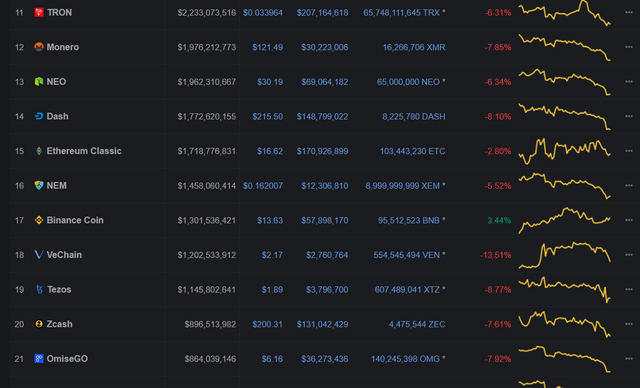
Can you immediately spot the trend-breakers - the coins which may do really well in the next bull market?
Here is what I see:
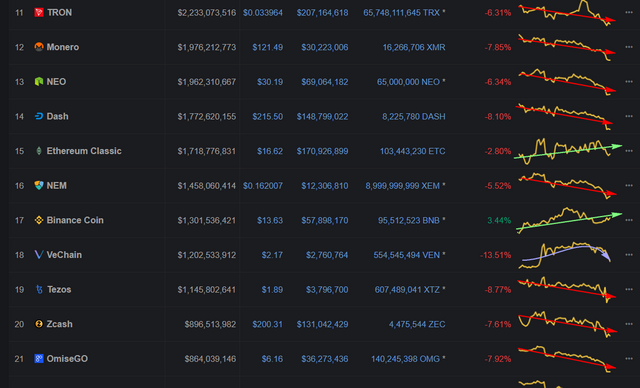
Ethereum Classic and Binance Coin are looking strong. I would want to put money on those two. None of the others really look worthwhile.
NOTE: ETC's 24h % is not positive! This is why I say it can be misleading. The volatile price fluctuations of ETC mean that 24 hours ago the price was at a peak, That makes current price look comparatively low, and the number turns negative. ETC is still a high market cap coin, this effect gets far worse at lower market caps. Look at Sp8de (a newly listed Cardano based token from my watchlist) for example. Would you trust a 24h % to give you any useful information from a chart like this?

The price fluctuations of Tezos (coin 19 in the previous screenshot) will cause similar havoc. Look how it bounces in price towards the right end of the sparkline. You can not trust the 24h % to be meaningful! Watch out for this!
VeChain is a strange case: it was bucking the trend, but now it has taken a big dip. To me this means that I should watch VeChain to see if it can swim upstream against the bearish price movement again, or if it will continue to fall. Note that Binance Coin took a dip within the last seven days, but then recovered. I'll be keeping a close eye on VeChain for the next few days.
Take a look at another example:
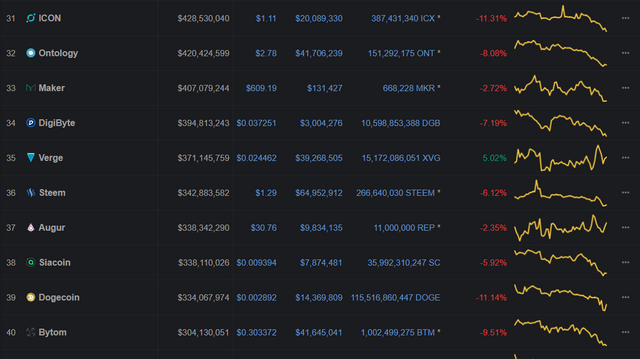
Did you see them again? Verge and Augur, both slightly positive. Once again: note that Augur has a negative 24h %.
Last example:
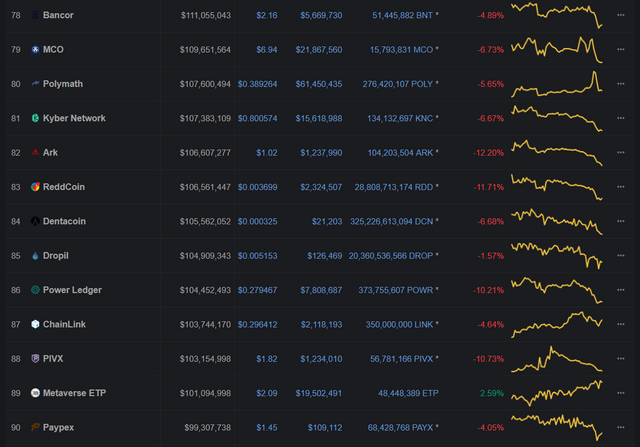
Polymath (a bit tricky to see because of the huge spike), Chainlink and Metaverse ETP.
Despite the very negative 24h %, Chainlink is one of the strongest climbers we have seen so far. Metaverse ETP is also looking string. Polymath is positive, but not excitingly so.
Using this system
The examples which I have shown here are the only ones from the CMC Top 100 that I see bucking the bear trend at the moment. It's not a perfect method, but I find it very fast and useful. I believe that it lets me see which coins may do well later on. The fact that a coin is able to show positive growth under bearish conditions must be significant.
Of course some growth may be temporary. For example: VeChain - our "questionable" coin may only have been showing growth due to the recent mainnet launch / wallet launch / token swap etc. Hype may fade and it may crash, OR investors may be excited about the functional new chain that is working well and VeChain could grow rapidly now and very rapidly in an upcoming bull market. You will have to decide.
Do not stop at just the sparkline analysis and go buying coins based on that alone. This only provides you with options: a push in the right direction as to where to go looking for potential good investments at this time. You still need to do a little TA / FA / research before you buy anything! You need to know things like "is this perhaps just caused by recent mainnet launch hype?"
Sparklines found in this way do not always have to be positive. They can also be less negative than the others. In a very bad market this is often the case. Everything in the Top 100 (except for Tether again!) can be red on a bad day, you've probably seen this before. The trick then is to look for those that are significantly less negative than the rest. The same principles apply.
As I have said before, this is so quick to do that it would almost be silly not to do it. It takes me less than a minute to do it for the Top 100 every day, as well as for my 70 odd Watchlist coins. The more you do it, the faster and more accurate you become.
I suggest that if you do not already do something like this, that you give this method a try. It does not replace proper research, but it works for me. Hopefully when the bull market finally arrives, my cons will do well and I'll be proven right! 😃 Hopefully!
Attribution: - all charts are from coinmarketcap.com - some are modified by Bit Brain where necessary
Yours in crypto,
Bit Brain

Bit Brain recommends:
Published on

by Bit Brain


I like binance coin, strong ceo and love polymath.
Every single time I see polymath I get angry that I decided against the ICO at the last minute. Perhaps I should buy some now while alts are so low...
Nice post. I think ETC is riding the coinbase wave, VeChain just released their mainnet an BNB has just acquired Trust Wallet....among other things.
ETC seems to be riding that wave better than the others, I don't know why. I agree about VeChain. BNB is a serial well-doer. I see KuCoin shares also picking up. BNB has so many reasons to climb it's hard to tell which one / how many are causing the current trend!
I think ETC is the one most likely to get listed on CB, where as the others are up in the air.
Don't say that... *holding thumbs for my ZCash...*
But yes, I agree with what you say.
I think I did the same exercise many times, but you managed to put the Technic in "Black on white".
Good post!
Thanks. I realise that half the work in blogging is describing what may be obvious to you, not always appreciating that many others may not know it - especially the new guys. I wish I had had a Bit Brain to follow when I was starting in crypto!
I don’t thing it is obvious...nonetheless The obvious things are sometimes the most difficult things to explain and you manage to do it brilliantly.
Steem on!
Don't stroke my ego, it's already bloated to bursting point! 😂
Seriously though: thanks.