BTC 17 October - Spot the difference
One of the problems with decentralisation is that standardisation is conspicuous in its absence.
Don't get me wrong, I love a free market, the freer the better as far as I'm concerned, but the lack of a common reference can be a bit problematic.
Take the recent Bitcoin breakout for example. Like I said yesterday: Bitcoin broke out of its converging triangle and remained trading at a level above the previous resistance line. Or did it?
There is a problem. Depending on which exchange or trading pair you use, the data looks different when you start to draw a few TA lines on the charts. On some of them BTC looks like it has broken out and stayed there. On others it looks like BTC has not broken resistance. We need to decide. You need to decide! (Or you can always just wait and see 😀)

From https://bitcoin.org/en/
BTC 17 October - Spot the difference
This is usually the part where I tell you that I'm going to show you charts and pictures and let you decide for yourself. I'm going to make it a little easier for you today by telling you what I think before I do that. I had thought that BTC did breakout and that it remained trading above resistance. But honestly, I am not 100% certain of this. I am seldom absolutely certain with crypto, it's not healthy to be too certain, especially in the short-term. But this time I am far less certain that usual.
I would love to say that BTC has broken out, it would be exactly the kind of thing that validates this post of mine from a few days ago. But there is good reason to believe that it has not done that yet, and honestly I'm in two minds about it. What do you think?
Next I am going to show you those charts. I'll keep my verbose mind under control and will limit the annotations to the bare minimum required. What I will do is present you a few BTC charts from major exchanges. Look at the differences and see what you think. I have tried to standardise the charts as much as possible so that you can compare apples with apples. All the charts have the following characteristics:
- They were captured at almost the same time.
- They have only one line drawn in on them: the resistance line of the previous triangle according to the data on each specific chart.
- They are logarithmic.
- They use day-long candles.
- They run over the same time period.
- The price scales are the same.
Here we go (in no particular order):
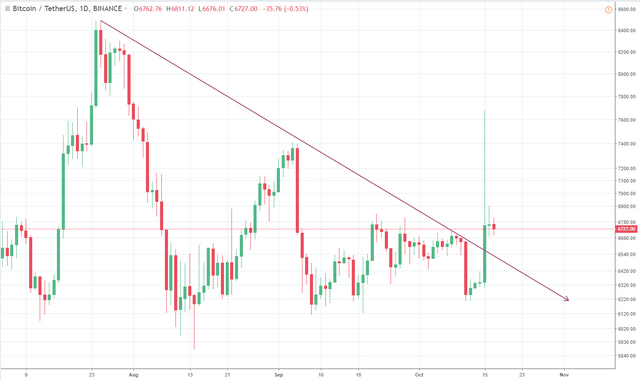
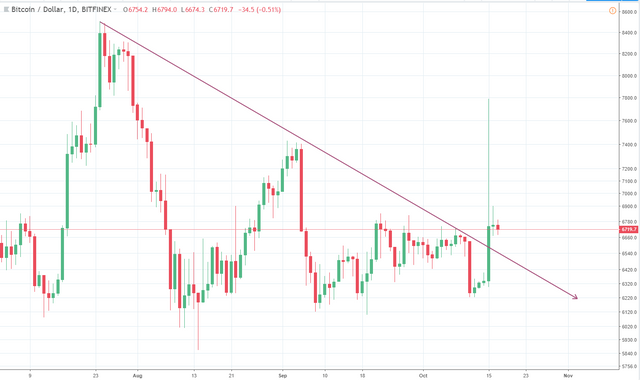
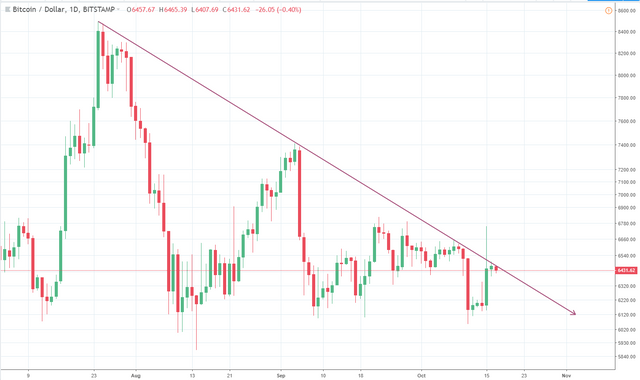
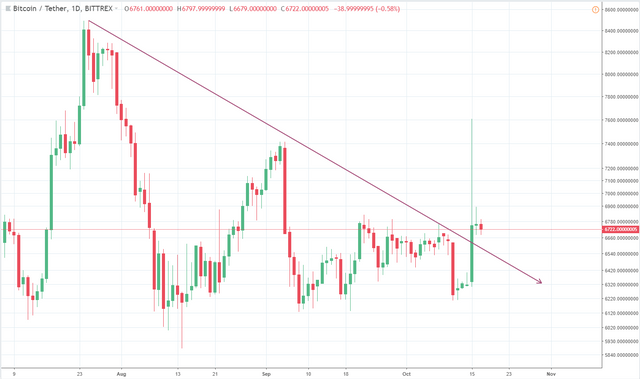
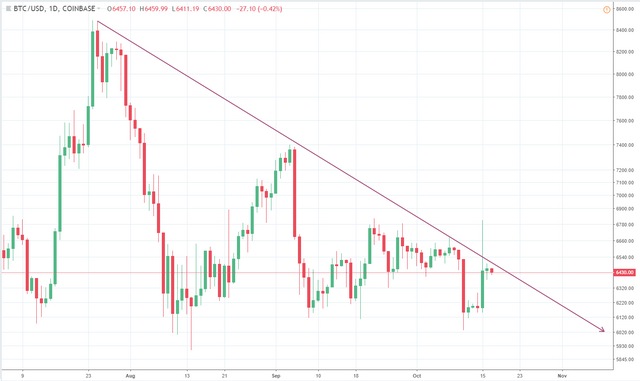
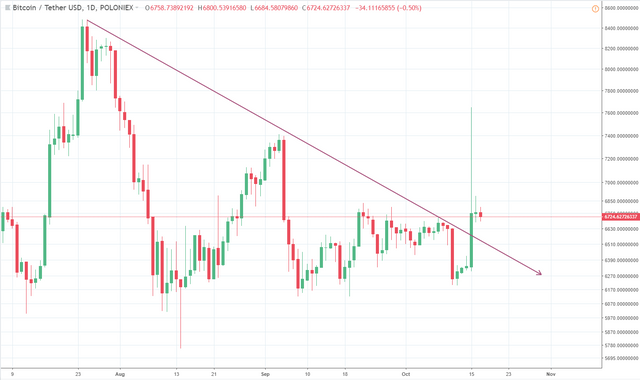
Note that while the Bitfinex/Tether issue (which caused the price spike that started the breakout) did make Tether dip, Tether bounced back and can be used as an approximation for USD again, at least for the time being. However, and this is critical, when I took the screenshots of these charts Tether was trading at about $0.972, not quite $1.00 as it should be on average. This is enough to put each Tether chart pretty much bang on the resistance line at the current BTC price for each chart. The Bitfinex chart is USD, not USDT, but since Bitfinex is linked to Tether and the source of the Tether problem that caused the BTC price jump, I do not think that Bitfinex prices can be fully trusted for the moment. So yes, I am definitely uncertain. I apologise for that, but you deserve to know when I am unsure of something and you deserve to know that other analysts and the market in general should be wary of this too.
It's going to make for an interesting next couple of days. I still think there is a very good chance of BTC dipping back down to the old support level again (probably around $6150 to $6200 because the lows keep getting higher), so do not panic if it does. But whatever happens in the short-term, I am as bullish as ever about crypto in the long-term and will keep hodling.
All charts made by Bit Brain with TradingView
Yours in uncertain crypto,
Bit Brain
Footnote: I started typing this post with a definite breakout view in mind, but then changed my mind and rewrote the post after taking a closer look at the charts and factoring the Tether price in more accurately. Even I can change my mind sometimes, even while writing a post! 😃

Bit Brain recommends:
Crypto Exchanges:


Published on

by Bit Brain

Thanks for the update! It is great that you can come back an update your thoughts as we all sometime need to adapt when we get additional or better information. The reality is that catching a bottom is tough but not necessary as the potential price increase can be caught on the way up when the trend is clearly higher.
"Update your thoughts" - I like that! From now on I will never be "wrong" again; I'll just be "updating my thoughts!" 😁
hehhehehe!!! Very good @bitbrain , well said. I also think we have to test again the lower support in order to jump up. There is where all the volume is now accumulating.
Yup!
I feel whether it may go up or down depends on how long the support is able to hold as there is a lot of positive news coming out about bitcoin in the next month or two. However even if it does dip it wont be significant probably just a good opprtunity (maybe the last) to buy low.
There has been a lot of positive news about BTC and crypto all year, but due to the bearish sentiment it has all been dismissed and swept under the carpet. I would say that we've had far more good and exciting news this year than we did last year! Any dip now will be about 10% tops, so I would suggest buying now and not waiting. Rather pay slightly more and be in the market, than miss the opportunity altogether. Besides it is hardly ever that someone buys at the real bottom and sells at the real top, though many traders claim to on a regular basis (they lie).