BACK TO NORMAL (One-liner)
The climb has taken hold and we are
Back to normal
The bear market is over and we are back in business.
It's true, because I say so.
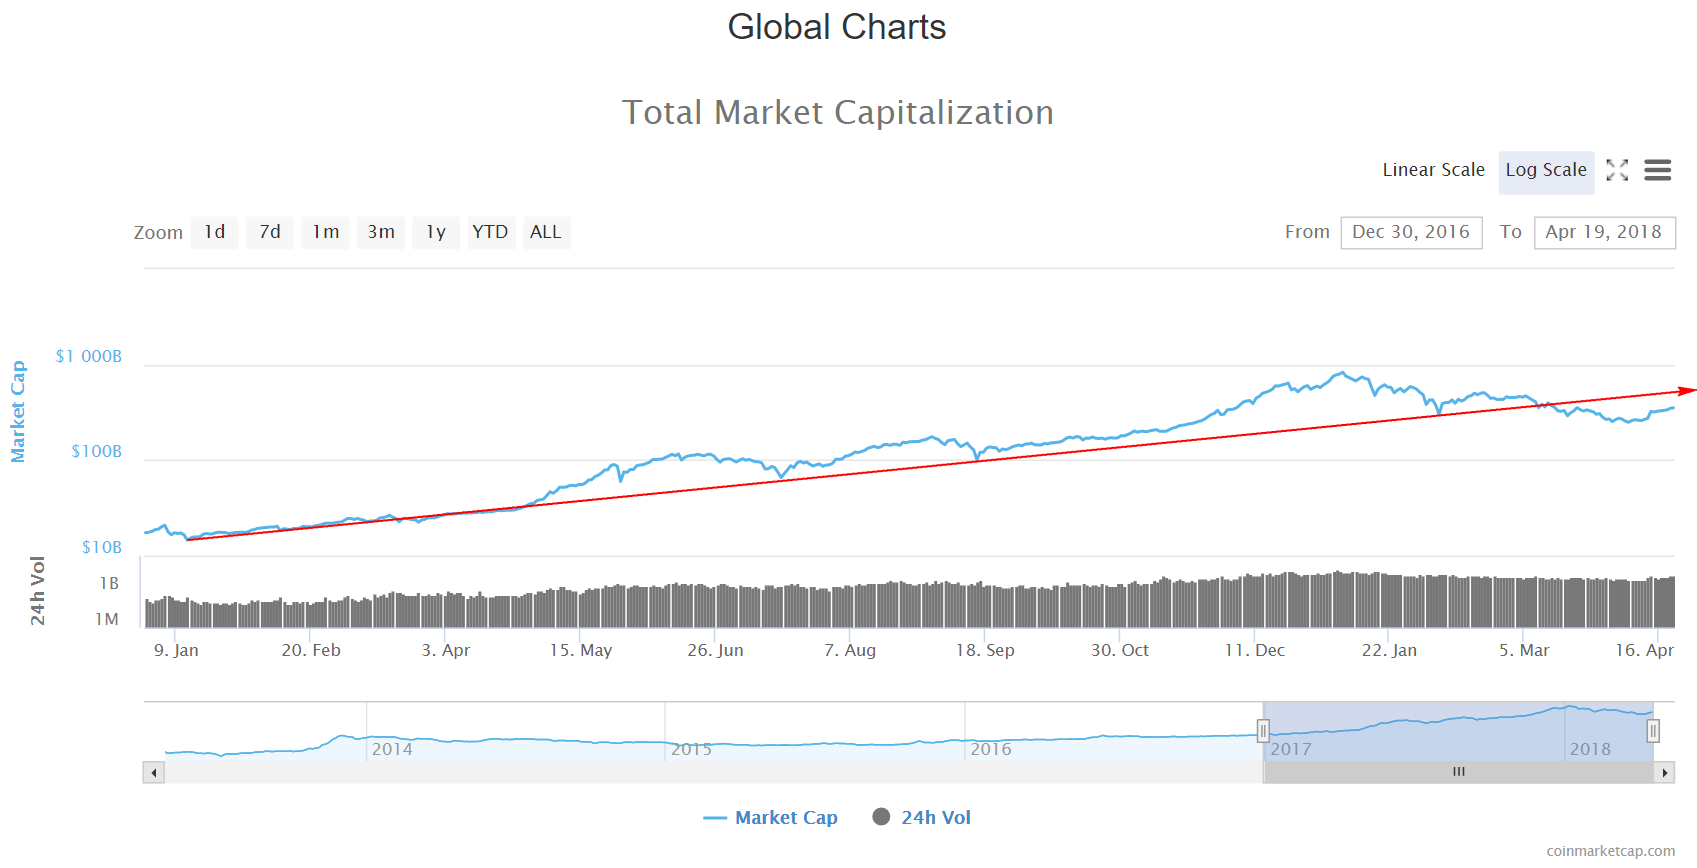
Now let's get back up to our logarithmic trendline.
Yours in crypto,
Bit Brain
DISCLAIMER:
I am neither a financial advisor nor a professional trader/investor. This is not financial advice, investment advice or trading advice. Unless otherwise stated, all my posts are my opinion and nothing more. Crypto is highly volatile and you can easily lose everything in crypto. You invest at your own risk! Information I post may be erroneous or construed as being misleading. I will not be held responsible for anything which is incorrect, missing, out-of-date or fabricated. Any information you use is done so at your own risk. Always Do Your Own Research (DYOR) and realise that you and you alone are responsible for your crypto portfolio and whatever happens to it.


ever the optimist... you know if you plot literally anything on a log scale you can make it look like it's going up ? :-) he he
I could plot it on a standard scale, but then it starts horizontal and goes vertical! 😂
Look, I'm not trying to con anyone here the way that statisticians do, those numbers on the side don't lie...
Historically these things have an ROI of about 10x within a year, that's easy to verify. We will see what the future holds. For now I can only go on TA and FA, and both look equally bright. I'm still calling it as I see it, just being a realist, I still hate optimists!
I was just amused by the log scale, you never see that used on normal stocks because they've been around forever and don't really move that much. I can understand it with crypto, especially with something like BTC which had a log increase.
I find the log scale to be the most useful. Due to the extreme price rises, all the early price movement detail is completely lost on a regular scale. The log scale allows you to compare early data with recent data on a level playing field.
I find them especially useful for establishing the long term growth trendlines, judging current performance and determining overbought/oversold situations. Study those little suckers long enough and you'll see where this crazy crypto fiend get's his wild crypto predictions from.
I may make a believer out of you yet... Incidentally, if you want to experiment with crypto, now is the time to buy and hold one or two low market cap gems.
Sorry, I still prefer investing, not gambling :-) lolol
For Bitcoin, I think you could just take the chart at May 2017 and rip off anything below that. It wasn't till then it started to look like a real stock. I've seen people put a lot of faith in what Bitcoin was doing in "The great Golden Cross of Nov 2015" or something, which is just ridiculous if think anything that happened then has any bearing at all on what's happening now.
That's why I think you shouldn't put too much faith in log scales, the stock has moved, grown up, moved on, people (not necessarily you) shouldn't be making trading decisions based on technical indicators from when the stock was a baby 3 years ago.