Analysis of long-term BTC patterns
My preference for pattern recognition is no secret
My objective for today was to try to match the Fibonacci levels of the previous big BTC bear market (in a nutshell: the whole of 2014) with the 2018 BTC bear market.
From this I hope to better predict the bottom of the market and see if it is in line with what I predicted yesterday: https://mentormarket.io/cryptocurrency/@bitbrain/bit-brain-s-bearish-bitcoin-bodement-part-2
Almost a week ago I acknowledged that:
I need to take a look at my long-term BTC projections again. With only the long-term now providing support for BTC, the long-term is more important than ever. Once I have something more solid to share then I will do so.
which appeared in this post. Today I'm making good on that promise. Let me show you what I've found so far.
Analysis of long-term BTC patterns
Methodology
To understand what I'm doing today, I want to show you how I came to my conclusions. I have always maintained that knowledge without understanding means little. I try to understand everything of interest to me. I suggest that you do the same, not just in crypto, but in all facets of life.
Now that the life skills coaching is done for the day, I'm going to show you a few charts.
Here is what I did: I started with the 2014 bear market. Using the highest price (at that time) as the starting point for my Fib levels, I retraced them downwards to the lowest price point of that market. But I didn't simply put the "0" level at the highest price and the "1" level at the lowest price, I lined up a few major Fib levels with the lowest price, while at the same time monitoring how the other Fib levels were lining up with the rest of the chart during that market.
I found four different permutations that worked. By "worked" I mean that they had several Fib levels which lined up rather well with resistance/support levels on the chart. (Ignore the unlabeled lines I have drawn in on the charts, those are part of my long-term trendlines and are not a part of this post.)
I then took those same four permutations and applied them to the 2018 bear market.

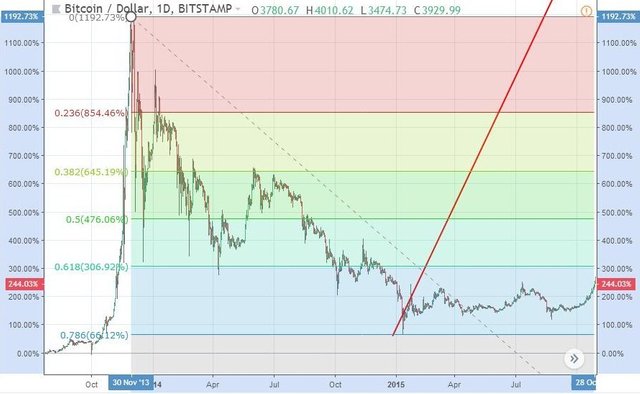
Chart 1 - 2014:
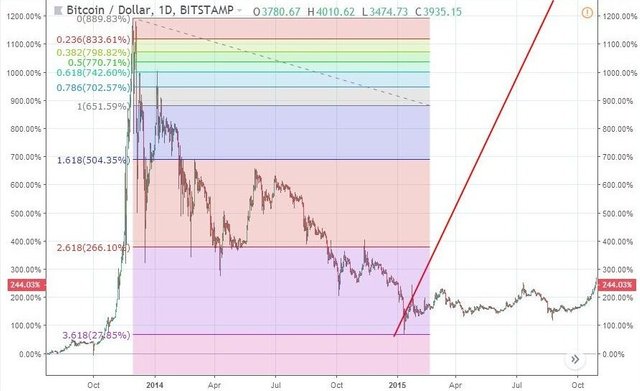
The Fib levels of Chart 1 didn't fit the 2018 market. In Chart 1, the 0.618 level lines up well with the first peak after the initial price drop and the 3.618 level then lines up precisely with the bottom of the market, with a few other levels lining up with other chart peaks and troughs in between - not so on the 2018 chart. So I dumped my Chart 1 attempt and moved on.
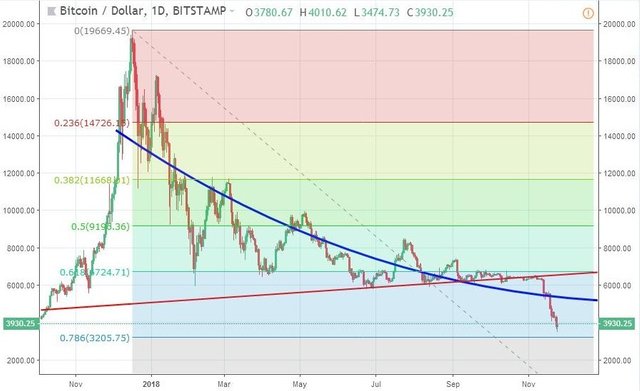
Chart 2 - 2014:
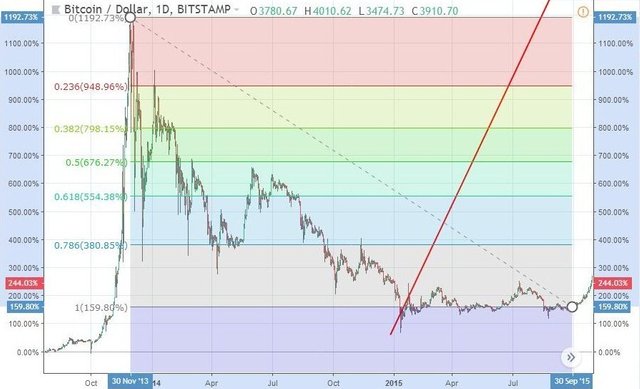
Chart 2 does correspond very well with the 2018 market. The Fib levels 0.236, 0.382, 0.5, 0.618, 0.786 and 1 all correspond with similar points or support/resistance levels on the two charts. But, it has no Fib level at the bottom of the market. This makes it almost useless to us, though it does indicate that the "1" level is an approximate post-capitulation level. Here is the 2018 version of Chart 2:
Chart 2 - 2018:
If the "1" Fib level is correct (and provided that I've interpreted everything correctly), then a level of about $6069 is a realistic level where BTC may consolidate after the capitulation dip has completed.
Chart 3 - 2014:
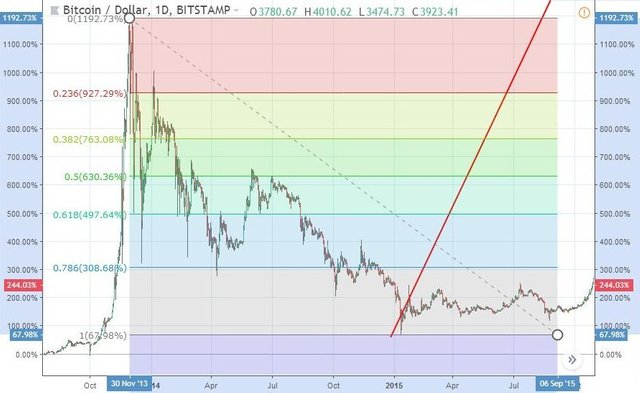
Chart 3 is more useful. As with Chart 2, all of the Fib levels correspond, with the exception of one very significant one. That final one is the "1" level, and it doesn't correspond because it is the bottom of the market. Since I believe that the bottom of the 2018 market has yet to be reached, the "1" level becomes a prediction of the bottom level on the Chart 3 (2018) chart seen below.
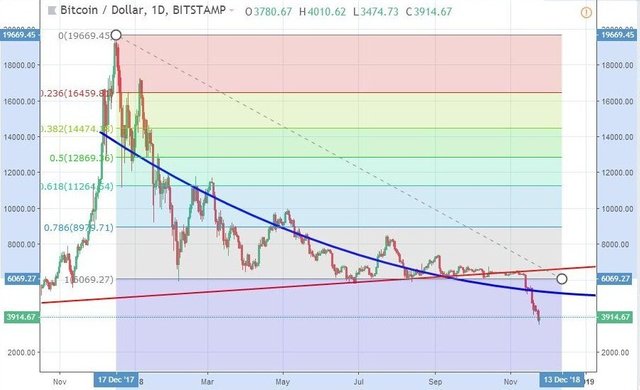
Chart 3 - 2018:
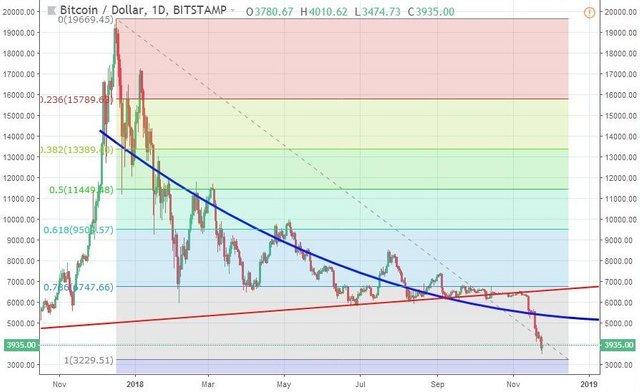
Chart 3 is predicting a market bottom of $3230 for this bear market cycle. That is in the ballpark of my $3000 prediction made yesterday, though not as close as what I would like it to be. But my post of yesterday is (like all TA) just a best guess. The figure of $3230 may well be the correct one. Or both could be completely wrong; this is crypto, anything is possible.
Chart 4 - 2014:
As with Chart 3, the Chart 4 Fib levels between the 2014 and 2018 charts correspond at every level except for the final one, the bottom of the market that has yet to occur in 2018. The 0.618 levels are the last support levels prior to the start of the capitulation events, with the 0.786 levels representing the bottoms of the markets.
Chart 4 - 2018:
Looking at the 0.786 level on the 2018 chart, we can see that the bottom of the market is predicted to be at a price of $3206. This is conformation of the figure from Chart 3, the difference ($3206 vs $3230) being well within the margin of error. Unfortunately for me it also goes against my $3000 prediction of yesterday.
Let's sum this all up.
Summary of conclusions:
- $6069 may be a realistic post-capitulation consolidation level (From Chart 2).
- $3230 is a possible bottom for the 2018 bear market (From Chart 3).
- $3206 is also a possible bottom for the 2018 bear market, essentially the same bottom predicted by Chart 3 (From Chart 4).
I can't ignore the fact that the predictions in this post differ a little from those I made yesterday. This is because I used different timescale Fib levels. The post I used yesterday was a short-term one, these were the levels I used:
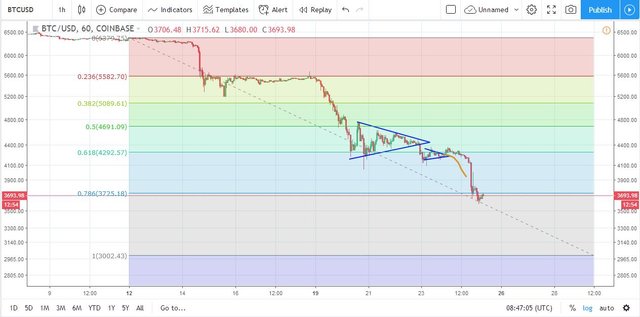
When information differs like this, I default to the longer-term data. With TA you always find that long-term is more reliable and more predictable.
So from a TA perspective the official Bit Brain answer to "How low will the market go?" is "just over $3200". But as I said yesterday, I still consider $3000 to be an psychological level and I expect many buy orders to be there. For that reason I am not dismissing it entirely. If "just over $3200" fails to stop the fall of BTC price, it should at least provide very serious support.
Those are my latest thoughts on how long-term BTC pattern projections relate to the current market by means of Fib levels. I hope you've found this post entertaining and that there is some value to what I am proposing. Let me know what you think.
All charts made by Bit Brain with TradingView
Yours in crypto,
Bit Brain
Bit Brain recommends:
Crypto Exchanges:


Published on

by Bit Brain

My bet is 3000$, of course I would change it if we overpass that level
Steem on
Posted using Partiko iOS
$3000 seconded as general bottom. I do expect one final big sell-off to the downside, maybe even below $2000, but it will be nigh impossible to catch it because it will be accompanied by a similarly high upward spike. So $3000-3200 seem like great buy in points.
You could always leave a trade open at the level you want couldn't you? Perhaps revising it every few days as the charts develop.
Good TA! Now we need to see if the emotions being seen in the market concur as they can get out of hand pretty quickly as we have seen as of late!
Posted using Partiko iOS
That's really what it's all about, isn't it? That all-powerful market sentiment.
Great historical analysis...as history tends to repeat itself.
Thanks. It certain does!