CryptoPortfolio - Simple trick to increase returns by 8% per year - Part 1: Geometric and Arithmetic Returns
Summary
Cryptocurrencies are extremely volatile. This creates an interesting opportunity to extract extra returns from rebalancing a portfolio and extract a “diversification dividend”.
In Part 2: Portfolio Risk and Diversification I quantify the effect.
In Part 3: how to make 8% more per year I calculate how much it can mean for the average portfolio
Geometric and arithmetic returns
First of all bit of definitions:
- Geometric returns are what you eat, it's the real compounded return that you can spend and hence it's what you want to achieve with any investment
- Arithmetic returns is an approximation of the above that is simpler and hence people tend to use it more often
Example: if you gain 10% then lose 10%, your arithmetic return is just the sum of the two which is zero but in reality you lost 1% (which is your geometric return). To see it take 100$, gain 10% and go to 110$ now the 10% loss will be 11$ so you end up with 99$.
The arithmetic approximation works relatively well with normal markets which move only a little, if you repeat the exercise above with gain and losses of 1% you get very close to zero.
But it works poorly with big moves: try with 50% gain and loss and you'll see that the portfolio is now down by 25%.
Cryptocurrencies are particularly volatile and hence this effect is particularly important.
As an aside, by the way, this means that for a crypto like bitcoin (which has a 40% to 80% volatility) to be a good investment you need some basic returns just to compensate for the Geometric effect. We will see how much later.
Geometric and arithmetic mathematical relationship
A well known formula links Geometric and Arithmetic averages and states
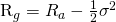
Where


This means that with 40% volatility you need to have a 8% annualised return (40%^2*0.5=8%) just not to lose money on average.
Bitcoin so far had a much higher return so we are fine.
Thanks for sharing... Love it.
Thank you, I would be grateful if you could also pet me know what you think of the second part of the post.
Thanks!
I think your premise is that the "variance" is constant or of constant range no matter what the value of the coin.
I wonder (without any statistical analysis) whether coin go up and down more in a numerical range and not a % range.?
Having said that the BTC which is slow to move still swings so wildly both in range and acceleration (slant of the line on the graph) - who knows? Lol
Very interesting though ty...im new to the idea of graph analysis with investment in mind...there seem quite a few interesting concepts eg when the 50day moving average crosses the 200 day, etc etc
Many thanks.