How to Read Crypto Trading Graphs: Learn About Cryptocurrency Charts, Time Frames, Candlesticks & Patterns
07 April 20
How to Read Crypto Trading Graphs: Learn About Cryptocurrency Charts, Time Frames, Candlesticks & Patterns
CRYPTO-TRADING
If you are interested in how to learn crypto trading, then you should also be willing to understand crypto trading graphs.
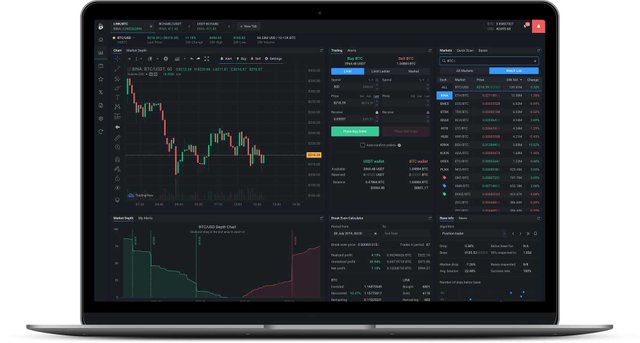
Even when you sign up for an account in any of the world’s most trusted crypto trading platforms, you can’t expect to earn altcoins or receive free bitcoin when you can’t make sense of crypto charts. You need to understand what is going on in the market so that you can make the right decision on when to buy and sell cryptocurrency or which trading action will give you most profits.
Cryptocurrency trading charts can be confusing and difficult to understand most, especially for beginner traders. Despite the seeming complexity of these graphs, know that it is not at all impossible to learn about them. Below are some of the necessary information about cryptocurrency charts that may help you.
Time Frames
Cryptocurrency trading graphs can look differently depending on the time frame that you have chosen. But how do you know which time frame is best for trading? There is no definite answer to this. The best time frame for you will be relative to your personal trading preference, style, and strategy.
Short time frames like hourly charts are usually used by intraday traders. These kinds of charts give traders a detailed picture of the crypto price movements for the entire day.
Longer time frames like daily, weekly, and even monthly charts are usually used by long-term investors to see the bigger picture and to examine a certain digital currency’s performance across market history.
Candlesticks
When you look at crypto trading graphs, what you will immediately notice are red and green candlesticks. But do you know these candlesticks can give you a lot of information about a particular cryptocurrency market?
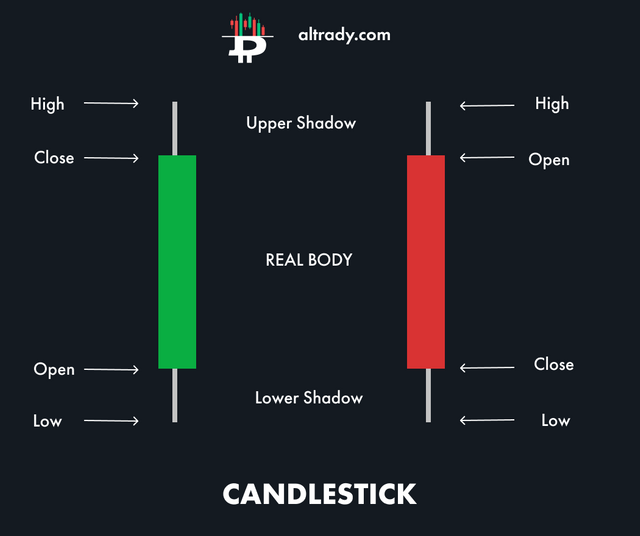
These candlesticks are essential elements in cryptocurrency charts. In essence, they give us a visual representation of how crypto prices move in a specified time frame. Just by looking at the four main components of these candlesticks, you will discover how traders react to specific market triggers.
So what are the components of the cryptocurrency trading candlesticks?
Open - This represents the price of the coin at the beginning of the trading period
Close - This represents the price of the coin at the end of the trading period
High - This is the highest price achieved during the same trading session
Low - This is the lowest price made during the same trading session
Body - This shows the difference between the opening and closing prices.
Shadows - These show how high or low the closing and opening prices have been.
Bearish and Bullish Reversal Patterns on a Candlestick
Candlesticks can help us know whether a particular digital currency’s price is having an uptrend or downtrend. A green candlestick represents a bullish movement. But what exactly is a bullish move? A bullish movement is an upward and positive movement of the graph because of an increase in price. You see a green candlestick when the closing price rises above the opening price.
On the other hand, a red candlestick represents a bearish movement. In contrast to a bullish movement, a bearish movement in the crypto market happens when there is a downward or negative movement of the graph because of the decrease in price. We see red candlesticks when the closing price falls below the opening price.
To help you visualize, here are some bearish and bullish reversal patterns that you may observe while trading cryptocurrencies:
Below, you will find an explanation of the three bullish reversal patterns represented in the image.
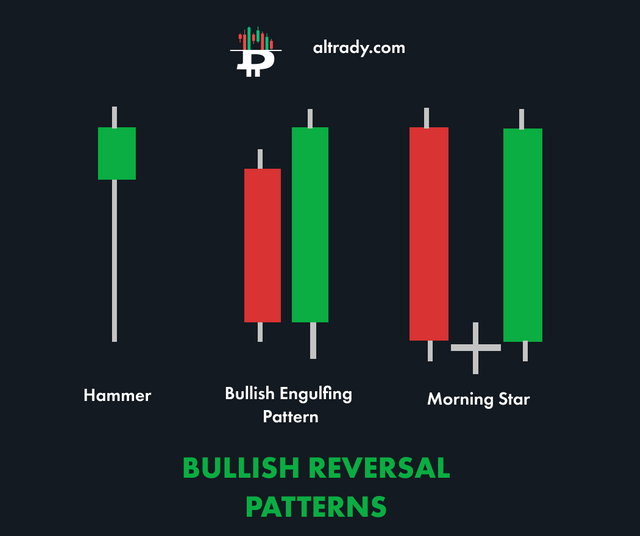
Hammer (Bullish Reversal Pattern) - This bullish reversal pattern has a very short upper shadow but a long lower shadow. This kind of pattern forms when the crypto price went down right after the market opened. But you will notice that it has then regained a strong momentum at the end of the selling period, thus bringing the closing price above the crypto’s opening price. A hammer pattern signifies that buyers are now entering the market.
Bullish Engulfing (Bullish Reversal Pattern) - Bullish engulfing pattern is a two-candle figure that shows both a bearish and bullish movement that happened in a particular time frame. The first candlestick is bearish while the second candlestick is bullish. Although it has both an upward and downward price movement, what matters more is the second candlestick because it showed that the market was able to gain a stronger momentum from coin buyers right after the sellers have initially controlled the trades.
Morning Star (Bullish Reversal Pattern) - Morning Star is a three-candle figure. The first candle shows a bearish movement, with the coin sellers being in control. The second candlestick may not look evident because it has a minimal range. The third candlestick is a bullish pattern with strong momentum from buyers who can make the closing price higher.
Now let us look at three bearish reversal patterns with explanations below:
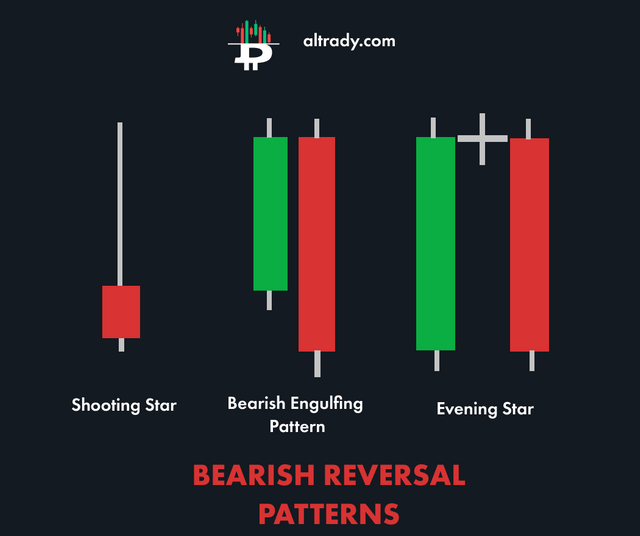
Shooting Star (Bearish Reversal Pattern) - Shooting Star Pattern resembles a shooting star movement with a short lower shadow and long upper shadow. The short lower shadow signifies that coin buyers were the first ones to be in control of the market when it opened. This reversed when the sellers had a strong momentum to sell off their coins, which consequently brought the market into a bearish movement.
Bearish Engulfing (Bearish Reversal Pattern) - Bearish Engulfing Pattern is a two-candlestick figure with the first candle showing a bullish movement while the second candlestick showing a bearish one. Although it started with an upward trend, the sellers gained strong momentum in the latter part of the time frame, which caused the coin to have a closing price that is lower than the first candle’s low.
Evening Star (Bearish Reversal Pattern) - The Evening Star Pattern is a three-figure pattern. The first candlestick shows a bullish movement with a higher closing price. The second candlestick has a minimal range and may not look so evident on the graph. The third candlestick, however, shows a bearish movement that is characterized by a lower closing price.
This information is mere guides to help you understand crypto trading better. It would be best to learn more crypto trading tips and be able to have an ultimate crypto trading strategy that will help propel your digital investments.
Take advantage of altrady’s advanced crypto trading software. We offer a free 30-day subscription.