Bitcoin - BTC bull run or bull trap? 6 key indicators

Oh take me back to the joys of the bull market! words echoed by every crypto trader since January. Right now we have the biggest calls that we have retaken the bull market however in this article I will give my take on if we are in the start of a prolonged bull-run or just another creepy bull trap.
LONG TERM:
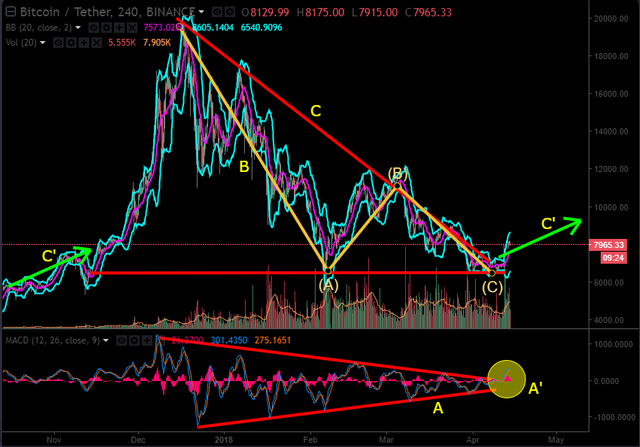
A: MACD squeeze. A squeeze of a MACD usually indicates a breakout either way and therefore can be risky to trade upon. However A' seems to indicate that the breakout has happened with a positive price change, music to everyone's ears. Furthermore, although not an exact science, MACD breakouts usually have some relation to the length of the squeeze, therefore indicating in this case that the breakout could be a long term trend reversal.
VERDICT: BULL-RUN SIGN
B: ABC corrective wave. Straight out of the Elliot wave handbook is the ABC correction. Although some parts of the BTC graph don't follow the the ABC completely, this is entirely common and furthermore, with something as speculative as Bitcoin, it would be extremely unlikely to not have some deviation. Additionally, the horizontal closeness of A and C indicates a lack of downwards momentum of the C wave, possibly indicating a strong motive wave coming up next, giving weight to bull-run signs, although this is not conclusive.
VERDICT: INCONCLUSIVE
C: Descending Triangle. This one is odd, as on the face of it this indicator is at odds with 'B'. As a descending triangle is an ABCDE rather than an ABC correction, however, this could actually in fact be market manipulation from the whales who have grown tired of the bear. Despite this, there is a very clear fall whilst the horizontal price remains a good resistance line on several occasions. Therefore this could indicate the bull is short term and we will still have to cycle through the D and E waves.
VERDICT: POSSIBLE BULL-TRAP
SHORT TERM: (As short term is less important, it will be covered in less detail)
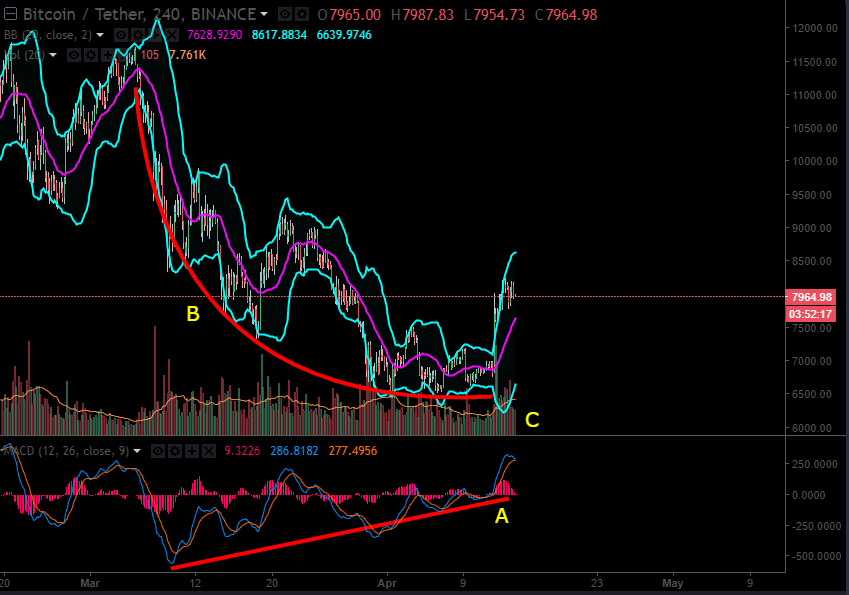
A: MACD divergence. higher lows on MACD and lower lows of price indicate a short term positive price run, however, the extent to this must be used within the longer term view expressed above.
VERDICT: INCONCLUSIVE ON ITS OWN
B: Parabola. A parabola is an indication of a short term price change and, given the nature of the curve, could indicate that this breakout is in fact short term and could therefore be seen to be a bull-trap as a parabola breakout reaction rarely exceeds the start of the curve.
VERDICT: SLIGHT BULL-TRAP SIGNAL
C: Volume spikes. Huge trend reversals are usually signalled by very large volume spikes and therefore the lack of single volume spike for BTC could indicate that this reversal is only a temporary one. However, given the nature of BTC within the cryptocurrency market, it is unlikely to show huge volume spikes in the way an alt-coin (or normal stock) would, and therefore it is difficult to trade Bitcoin simply by volume anaylsis.
VERDICT: INCONCLUSIVE
Congratulations @balbion! You have completed some achievement on Steemit and have been rewarded with new badge(s) :
Click on any badge to view your own Board of Honor on SteemitBoard.
For more information about SteemitBoard, click here
If you no longer want to receive notifications, reply to this comment with the word
STOP