Pennant Formation on LTCBTC
Hey guys,
I love chart patterns and I was working up a blog post on the bullish flag formation and stumbled across a couple formations I wanted to share on LTCBTC, Litecoin/Bitcoin,D.
First, it's important to understand that if you see a chart pattern on a specific security that its not guaranteed to produce the results you're hoping for. However, when combining multiple technical indicators you can really limit the potential for loss on the initial buy.
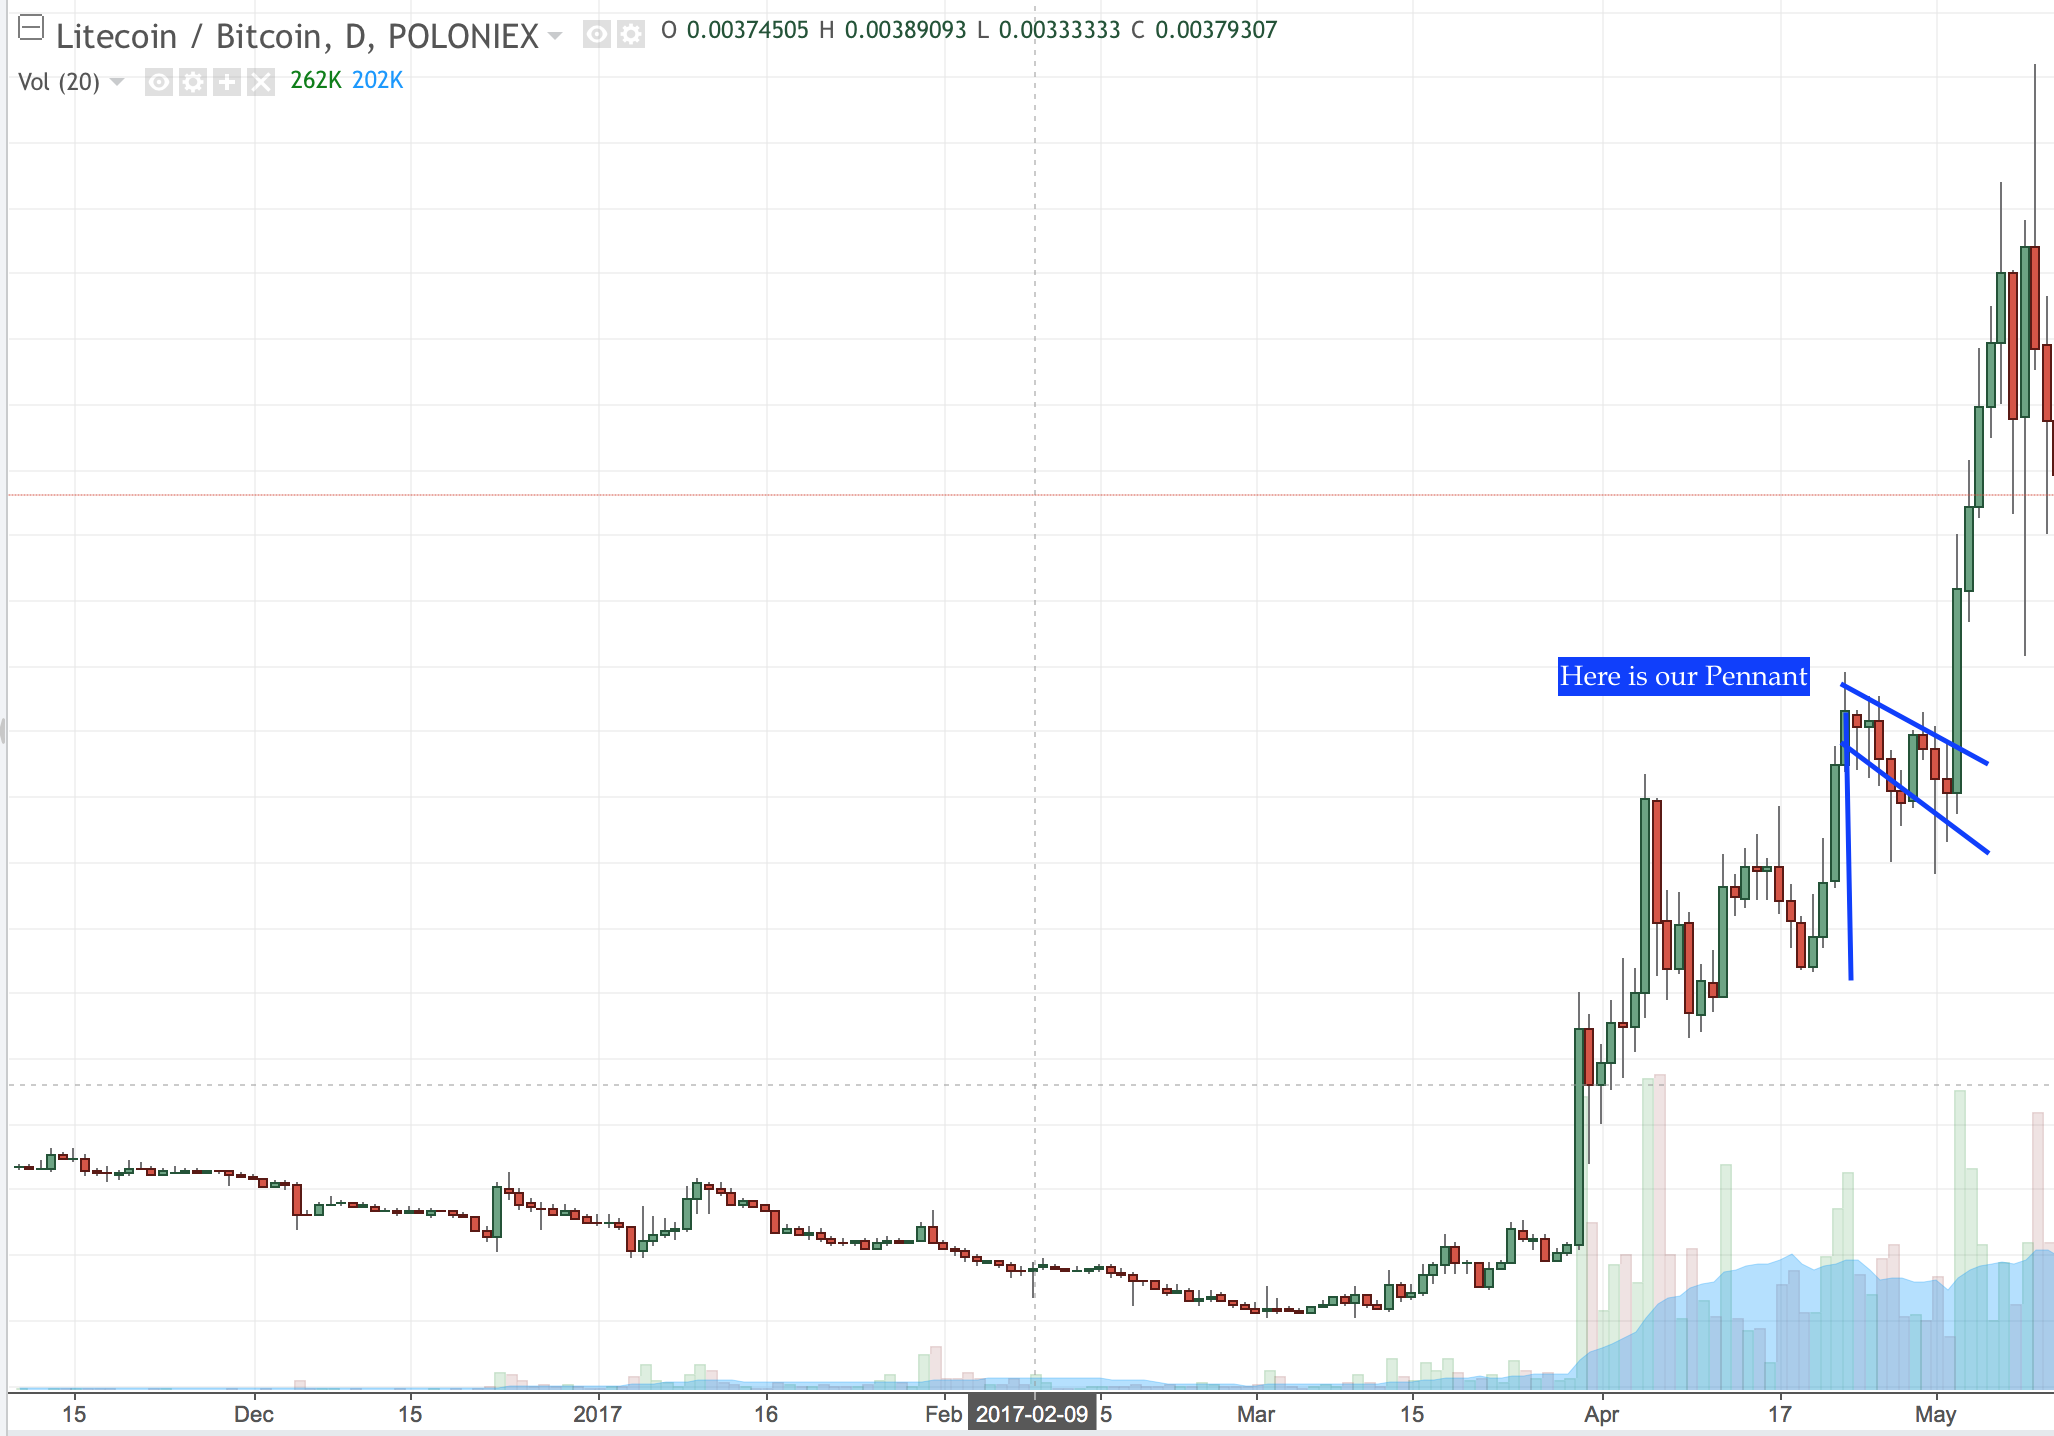
The chart below is showing multiple patterns. First, I'll point out a nice bullish pennant formation:

Now, as a trader this would have been a great signal to buy on because as we can see below it quickly rose up to create some nice profitable opportunities. With such a rise though we can assume there is going to be a dip in the near future coming.
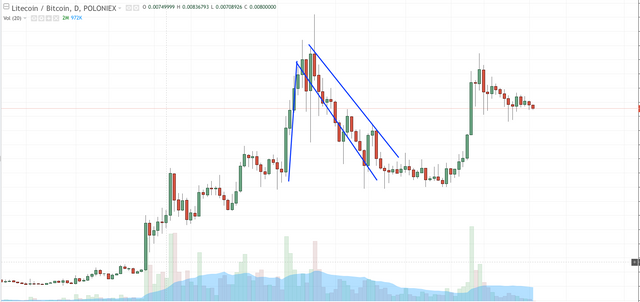
Remember, hindsight is 20/20 so in this case we can easily see it was a bearish flag/pennant pattern that ended up forming:

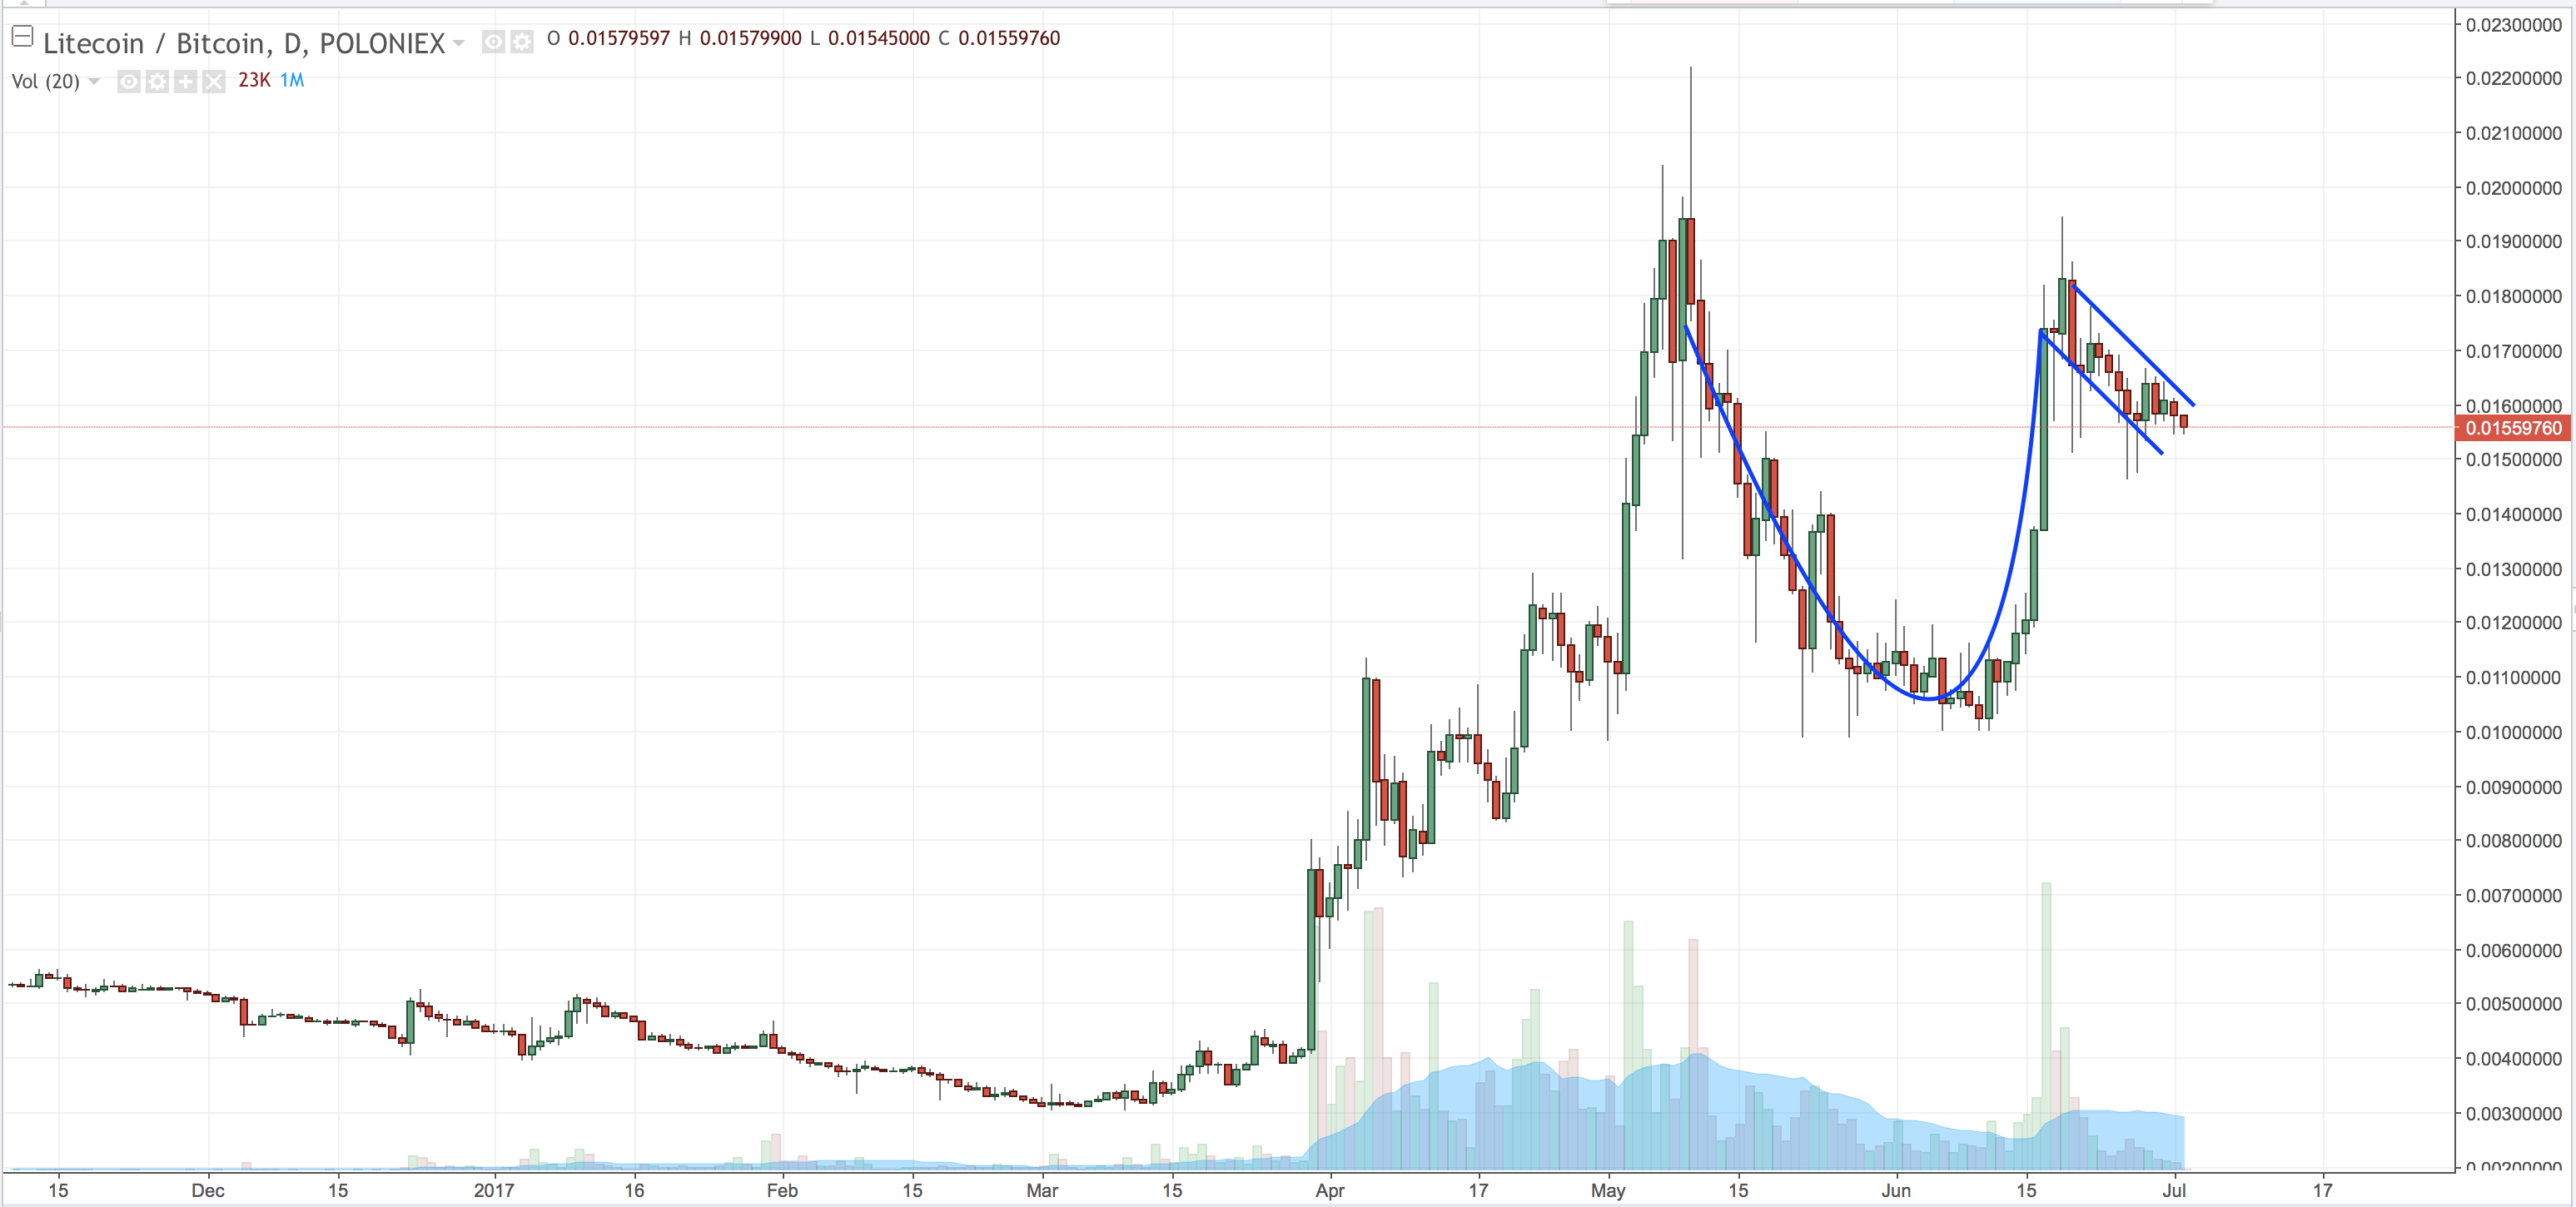
Usually when there is a bearish flag and we see such a downtrend we can hope that there will be a reversal because the buyers will start picking up cheaper shares and thus raising the price. We not only see this on the chart but we can also see another pattern/formation that has come about. What we're seeing is a Cup and Handle formation appearing:

This cup and handle pattern is a strong bullish sign. If successful we are likely to see this security experience an uptrend in price and volume. What it's done is had a dip over a period of time that was slow and steady, which has allowed a lot of buyers to get in at reasonable prices. With the sudden increase in price it causes buyers to become sellers as they want to capture some of that quick profit. This forms the handle. As the price decreases a bit we get a new set of buyers coming in and purchasing up some shares in the hope that there is going to be an uptrend.
It's important to combine this technical analysis with your own research as the more you do the more you can tone the risk down.
Thanks for reading and good luck to everyone!
Good Analysis
Love charts
Technical Analysis is key for financial markets prediction