Hello Steemians
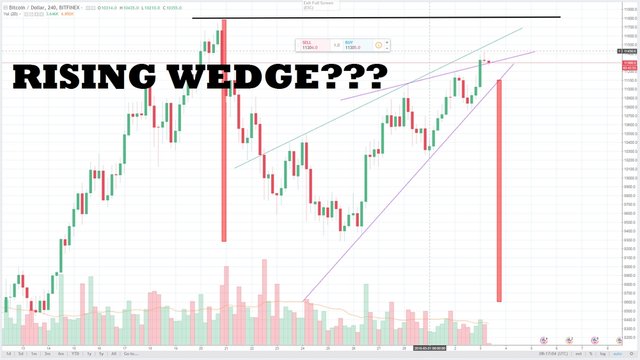
As part of my journey to learn more about technical analysis, I have decided to start learning to look out for patterns and share with you. Today, what appears to be a "rising wedge" has started to form...

DISCLAIMER
Before I go on with the journey, just want to include a Disclaimer. I am not a financial advisor and hence please do not take any part of this post as financial advice. I created this post because I am interested in cryptocurrency and technical analysis and want to learn more about it. Please perform your own due diligence.
OVERVIEW
 This is trading view if you are interested: https://www.tradingview.com/
WHAT AM I SEEING???
A "Rising Wedge" is starting to form. If you are not sure what a "Rising Wedge" pattern looks like, it is basically the 2 purple lines that are drawn above.
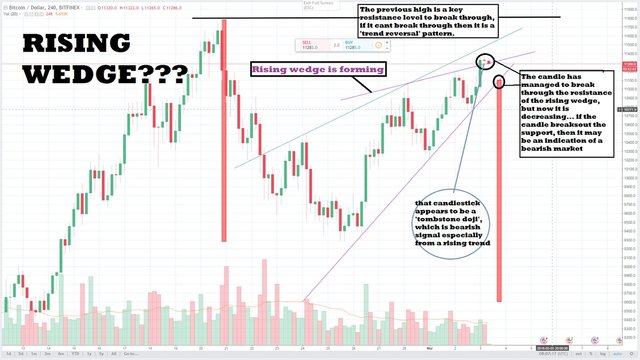
Theory goes that if a trend enters the Rising Wedge bearish, then when the trend breaks out of the wedge, the trend will be bearish. What that means is that the price was decreasing when it entered the rising wedge. It hit the resistance (top part of the rising wedge), and goes down to the support (bottom part of the rising wedge), and repeats.
EXPLANATION
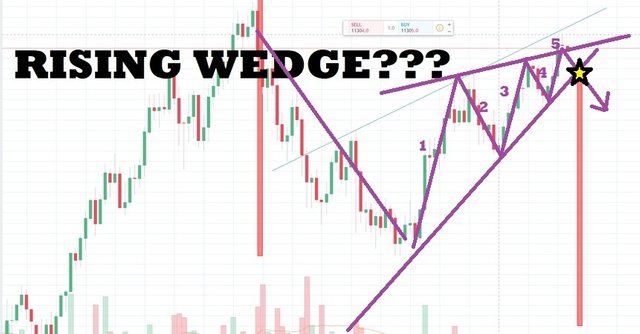
There is typically a 5 wave pattern, up, down, up, down and up - and if the next candle is red, then it is likely for a breakout to occur, if the trend breaks out the bottom of the rising wedge, then it is a bearish indicator...
At the moment, it seems like the trend has exceeded the top of the 'rising wedge', so if it stays above the wedge, until the time the 2 purple lines meet, then the "rising wedge" pattern may no longer be applicable. So the next few candles are important...
For the trend to be bullish, the trend will have to break the 'rising wedge' and the next resistance would potentially be the previous high.
Let me know what you think.
The amazing page dividers are created by @kristyglas

Thanks for your time and have a wonderful day!
I believe the pattern you are looking at is an ascending channel. Its not really indicative of a bull or bear pattern. But more of a range bound in a positive manner. Wedges are formed when higher highs and lower lows are no longer happening (also called consolidating).
Just my two cents! Always do your own research and form you're own opinion. TA can be a great tool and good luck on your journey
Thanks @luu78 for the comprehensive response. I only started learning about technical analysis recently and was quite interested in it. The reason why I though this is more of a "rising wedge' then an 'ascending channel' is because of the trend lines. If you draw a trend line on the past few days, you will see that the trend line is not really parallel, if it were a ascending channel then the trend lines would be more parallel.
Again, what I know is limited, but I am willing to learn and hear the opinions of others.
Looking at the more recent developments, the trend seems to have broken through the resistance. I agree doing research and forming an opinion by yourself is very important. Thanks. Have a great day !
I find things are not an exact science when it coems to exchanges. I think the most important part is to form a believe and see it through and understand why it happened. Only through experience will it make sense!
Cheers man, good luck!
i gave up daytrading because i just could not understand the graphs.
i really like people that try to explain this sort of stuff to people.
thank you for the article :)
Thanks @darkdrake. Glad you find it interesting. I am also very new to reading the graphs, also learning myself. Have a great day!
Thank you for the great content https://9blz.com/rising-wedge-pattern/