Trying to learn how to read cryptocurrency charts/graphs ... breakout???
Hello Steemians

DISCLAIMER
Before I go on with the journey, just want to include a Disclaimer. I am not a financial advisor and hence please do not take any part of this post as financial advice. I created this post because I am interested in cryptocurrency and technical analysis and want to learn more about it. Please perform your own due diligence.

OVERVIEW
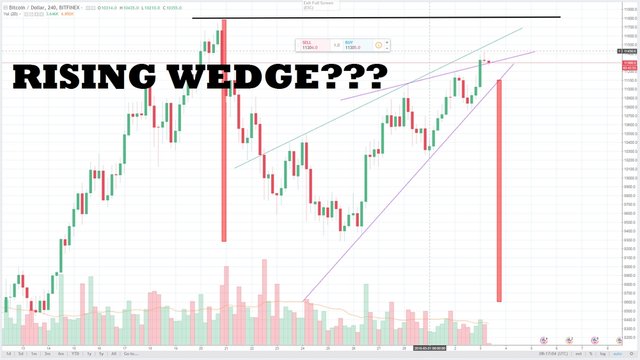
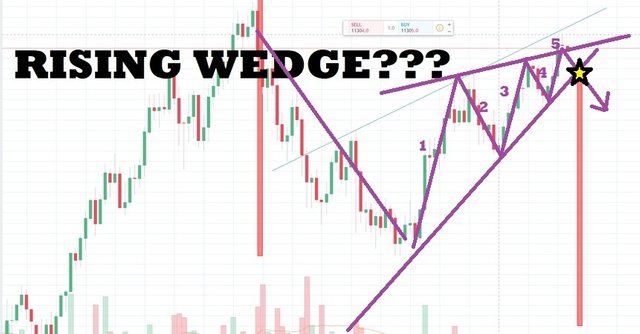

WHAT ACTUALLY HAPPENED?
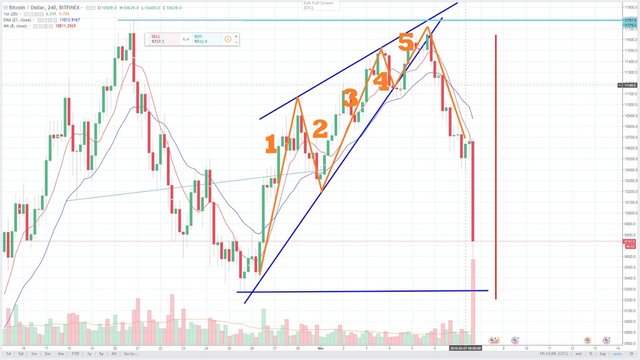

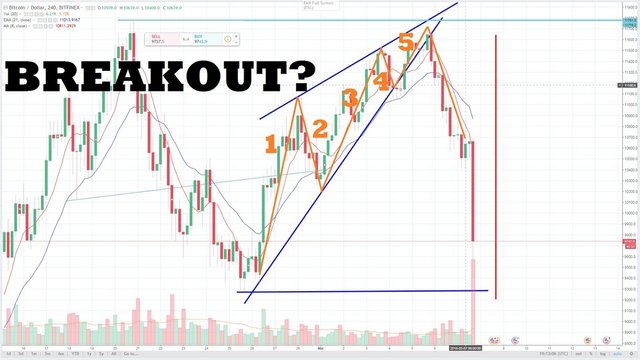
WHAT DID I LEARN

There is value to technical analysis, but there are two very important things:
- You must not be too emotional
- You must spot and identify the correct pattern
Although, the pattern that I spotted initially was potentially a "rising wedge", I did not draw it correctly, and here are items that I should take note going forward:
- An 'increasing wedge' is a bearish pattern, if the trend that enters the 'rising wedge' is a downtrend then it is a continuation pattern, if the trend that enters the 'rising wedge' is a upward trend, then it may be a reversal pattern.
- When drawing an 'rising wedge', since it is a bearish patter, one should start drawing the breakout line first, which in a bearish pattern would be the support (the bottom line)
- the line is drawn by connecting the bottom of the first low candle entering the pattern and the next 'higher low' candle.
- To determine the resistance (top line) of the 'rising wedge', one will need to take note of the candles touching the support line.
- In this case, one would draw the top line, by connecting the first top candle entering the pattern, and the next top candle (before the trend hits the support of the rising wedge). This may sound a bit confusing, but the purple one that I drew initially was incorrect and the blue one that was drawn is correct.
- There are typically 5 waves to a rising wedge, and once the trend hits the 5 wave (which should hit the top line of the rising wedge, it is time to look for an entry point.
- In this case, there is another interesting feature in that the 5th wave did not hit the resistance, and rather only hit half way and went straight down. This sometimes happen and can be called a 'truncated 5th wave'. it usually rises to a similar level of the 3rd wave and also counts as completing the pattern.
- One may then look for a shorter time frame to look out for an execution point.

Let me know what you think.

