Geometry 101
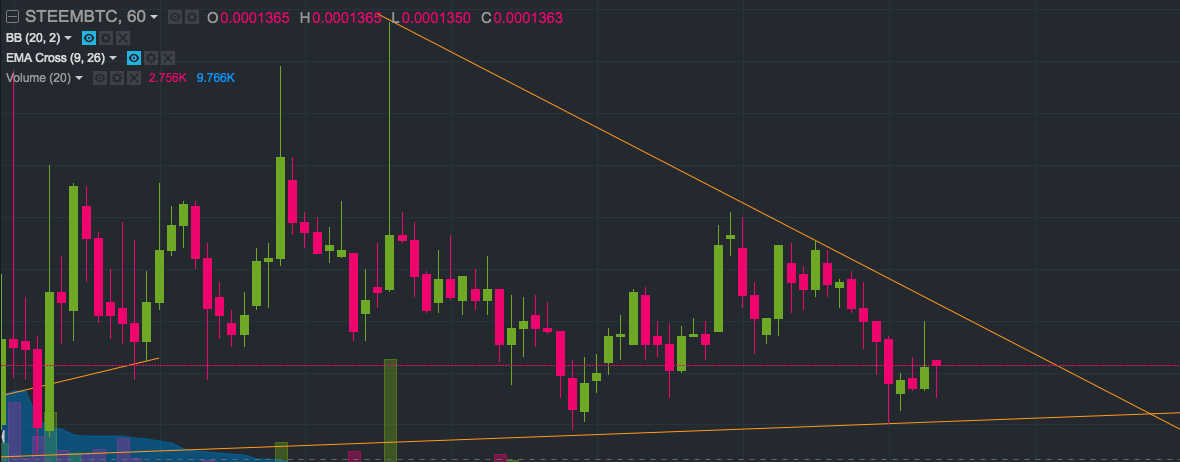
This is a triangle. But a different than you know, this is a late triangle. :)
Blame the RC, not for the price drop but didn't allow me to post in time.
This is how it looks now.
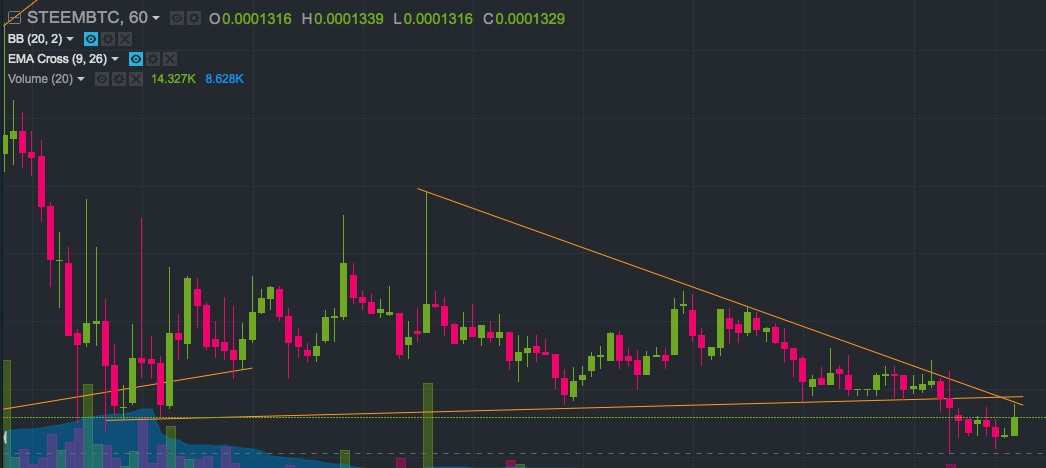
Nevertheless, this is just a simple geometry lesson not a trading advice as ever. You shouldn't even follow one or two opinions two put your money on risk. There are many indicators that many cryptocurrencies following so just go read about them a little bit, take a look at MACD, RSI, Bollinger Bands. Apply a Fibonacci Retracement to this chart for example, I like how they look too.
Have fun and don't risk what you can't afford to loose, things get easier than.
ps. I used to post these short ones with @oup however he doesn't have enough SP/RC even its full state so here we go.