Trading CryptoCurrency is like going Tuna Fishing!
Trading CryptoCurrency is like Going Tuna Fishing
As much as the title of this article may sound like classic click bait (pun intended), it is meant to serve the purpose, of explaining some technical principles of how traders trade, through the medium of fishing! I've chosen this topic, as I've just come back from fishing in the Med so it's on my mind....
Trader's use complex nomenclature for what really is quite simple ideas. Sorry traders who like the lingo to sound clever! As one reddit article puts it, when fishing, the more fishing lines you have in the water, the more chance you have of catching a fish, no shit sherlock, you may be thinking....
So picture the scene, you are on a fishing boat doing 5 knots, the waves are crashing, you're soaking wet, its pitch black, 5am and you were out drinking last night. There's a slice of pizza left over from the restaurant last night and you are resisting eating it. Your brain ain't firing on all cylinders and you are trying to get your lines out. Almost inevitably, putting multiple lines out is going to result in them all getting tangled together behind the boat, and the 6am-9am shift is going to be spent trying to reverse the entropy and seperate the lines. How can you apply the algorithms traders use to minimise this. Let's go fishing first, trading second.
The trick to laying your lines, is to apply Newtonian Physics. I know what you're thinking, how on earth can this article be mixing secondary school science, tuna fhishing and crypto trading? Well, thats the fun of writing blogs!
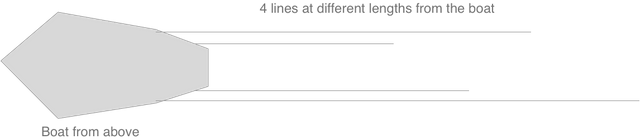
So your boat is moving in a straight line at a constant speed. Your four rods are positioned at the back of the boat, two on the sides, positioned low, and two are high up on the top of the boat. The lines will troll behind the boat as the boat moves. Using weights on the lines, we can firstly get different depths on the lines, for fish at different heights, but can also stop the lower lines, potentially getting tangled with the higher lines when more line is let out.
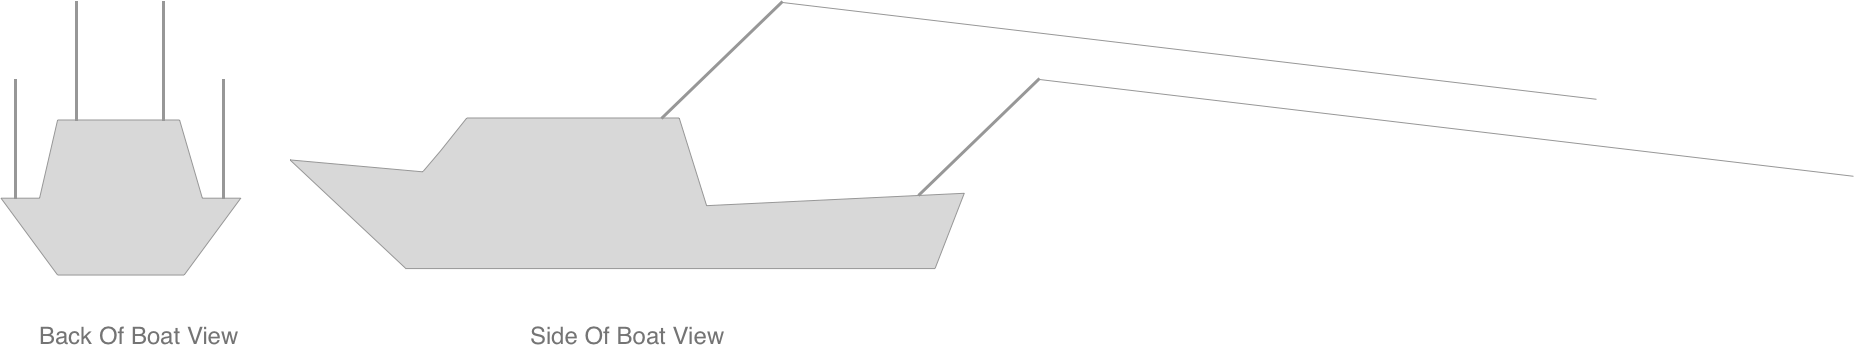
So basic principles, if we were fishing in a pond, with no currents and no winds, before we catch anything; if each line is of different length, with different weights on each of the lines, and we are travelling in a straight line, then there should be no problems keeping the lines from tangling. However, in reality, there are currents, winds and turning is, at some point, necessary. Not only that the goal is to catch fish! When that happens, they do not respect your neatly laid lines at all, thrash about, get everything tangled and set you back to the start....
Apply Science:
The first thing to do is move like a planet. Always turn the boat in the same direction, say, left. I.e if you want to turn 90 degrees right, then do a 270 degree turn left. However, the recommended approach, is to keep in an oval shape, over and around the area you believe to be full of fish. When you do this, each of the lines behind the boat, will follow the boat to a differing degree of sensitivity. The shortest line, will follow the path of the boat most closely, while the longest line will follow it least closely. In fact, the length of the line will determine to a proportional degree, the 'average path' the boat took, as it moved through the length of the line.
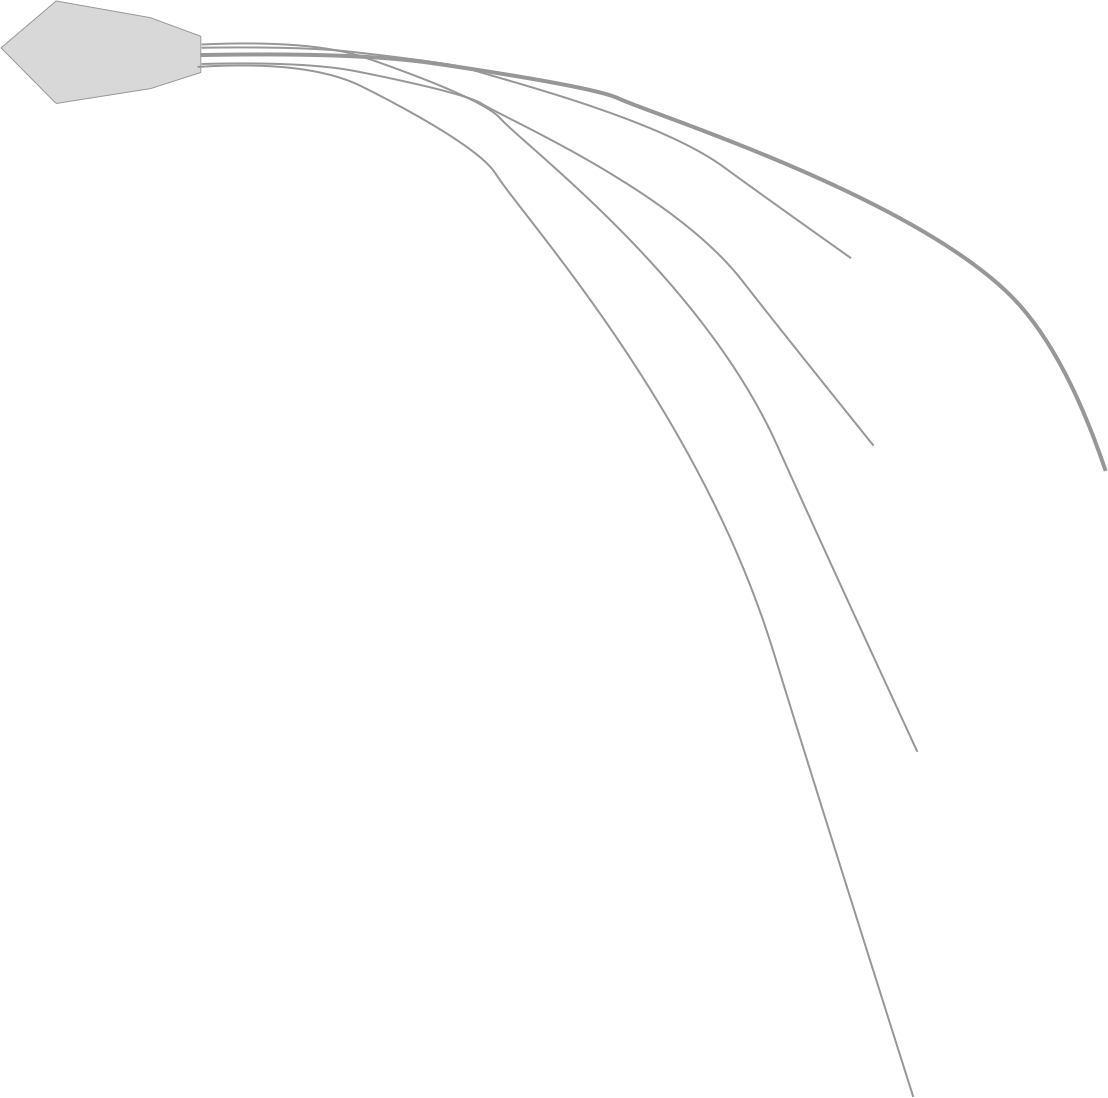
Excuse my diagrams..... but the principle I am trying to show here, is the 'lag' that each of the lines will have, relative to the actual path of the boat. The path the boat took is the thicker grey line, coming out the back. Each of the thinner grey lines, are the four fishing lines' paths as the boat turns left. As hopefully you can see, the shortest line follows the path of the boat most closely, while the longest line follows the path of the boat least closely. This is due to the drag on the line, and it affects the line proportionally to how long the line is. Infact, if we keep up the circle/oval, the force on each of the lines, (as long as we aren't "Perfect Storm" fishing) will counter the affects of current on the lines, and give us a sure fire way to keep the lines apart and not getting tangled up.
The Key to understanding how CryptoCurrency is traded, comes when the boat changes direction. When the boat turns right, we get an amplified affect in the opposite direction. The shortest line will start to follow the path of the boat first, or more 'sensitively' than the longer lines. This means that the shortest line will cross the path of the next shortest line, and for a short period, the only force applying to both, will be the currents in the water. At this point anything can happen. Lines bob up and down with the waves, and the currents - even the winds. The key here is the principle of sensitivity of the shortest line. As the boat continues to turn, the next shortest line will cut across the 3rd line, (as will the shortest continue to do so aswell), now giving us the potential for 3 lines to get tangled, and if the boat continues to turn right, the 4th and longest line joins the party.
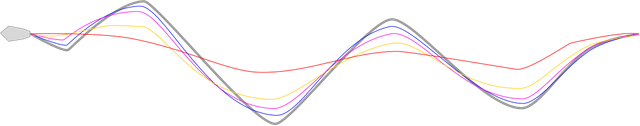
Once again, excuse me for my diagrams, but hopefully here if I tell you:
- Grey is the actual path the boat took
- Blue is the path of the shortest line, it follows the path of the boat most cloesely
- Pink is the path of the next shortest
- Yellow/Orange, is the path of the next shortest (the second longest)
- Red is the path of the longest line.
Each time the boat goes around the corner, the more sensitive (to turning) lines change direction faster, giving us an indication of a direction change (if we took away the boat and its path, we could detect a change in direction based on whether two line paths cross. The more lines the blue one cuts through, the more aggressive the change in direction must have been. I.e small turns, would result in less cross over of lines, whereas larger turns result in more cross over of lines. So in effect, the number of lines crossed by the shortest indicates the severity of the turn, and the more chance of tangled lines!
In fact, the three shorter lines each indicate how long the change in direction has been going on for. If the second shortest line, crosses the third, then we can infer that we have been turning a corner for quite some time!
Readers maybe have seen where I am going with this. Lets talk about Crypto Trading. One of the simplest tools to analyse the price of a specific CryptoCurrency is what is called SMA - Simple Moving Average Technical Analysis. The idea is you take two moving averages of the price of the currency, for the first, perhaps you take the last 10 prices of the currency, and continually average them, this is analogous to our shortest fishing line. You keep taking this average as the price updates.
The following diagram is the "candle-stick chart" of a crypto currency taken from bittrex.com over some time period. The green and red vertical bars are known as candle sticks, and each one represents the price movements of the currency for a 5 minute interval. Long story short, if the bar is red, the price dropped over the 5 minutes, and if its green, the price went up over the past 5 minutes.
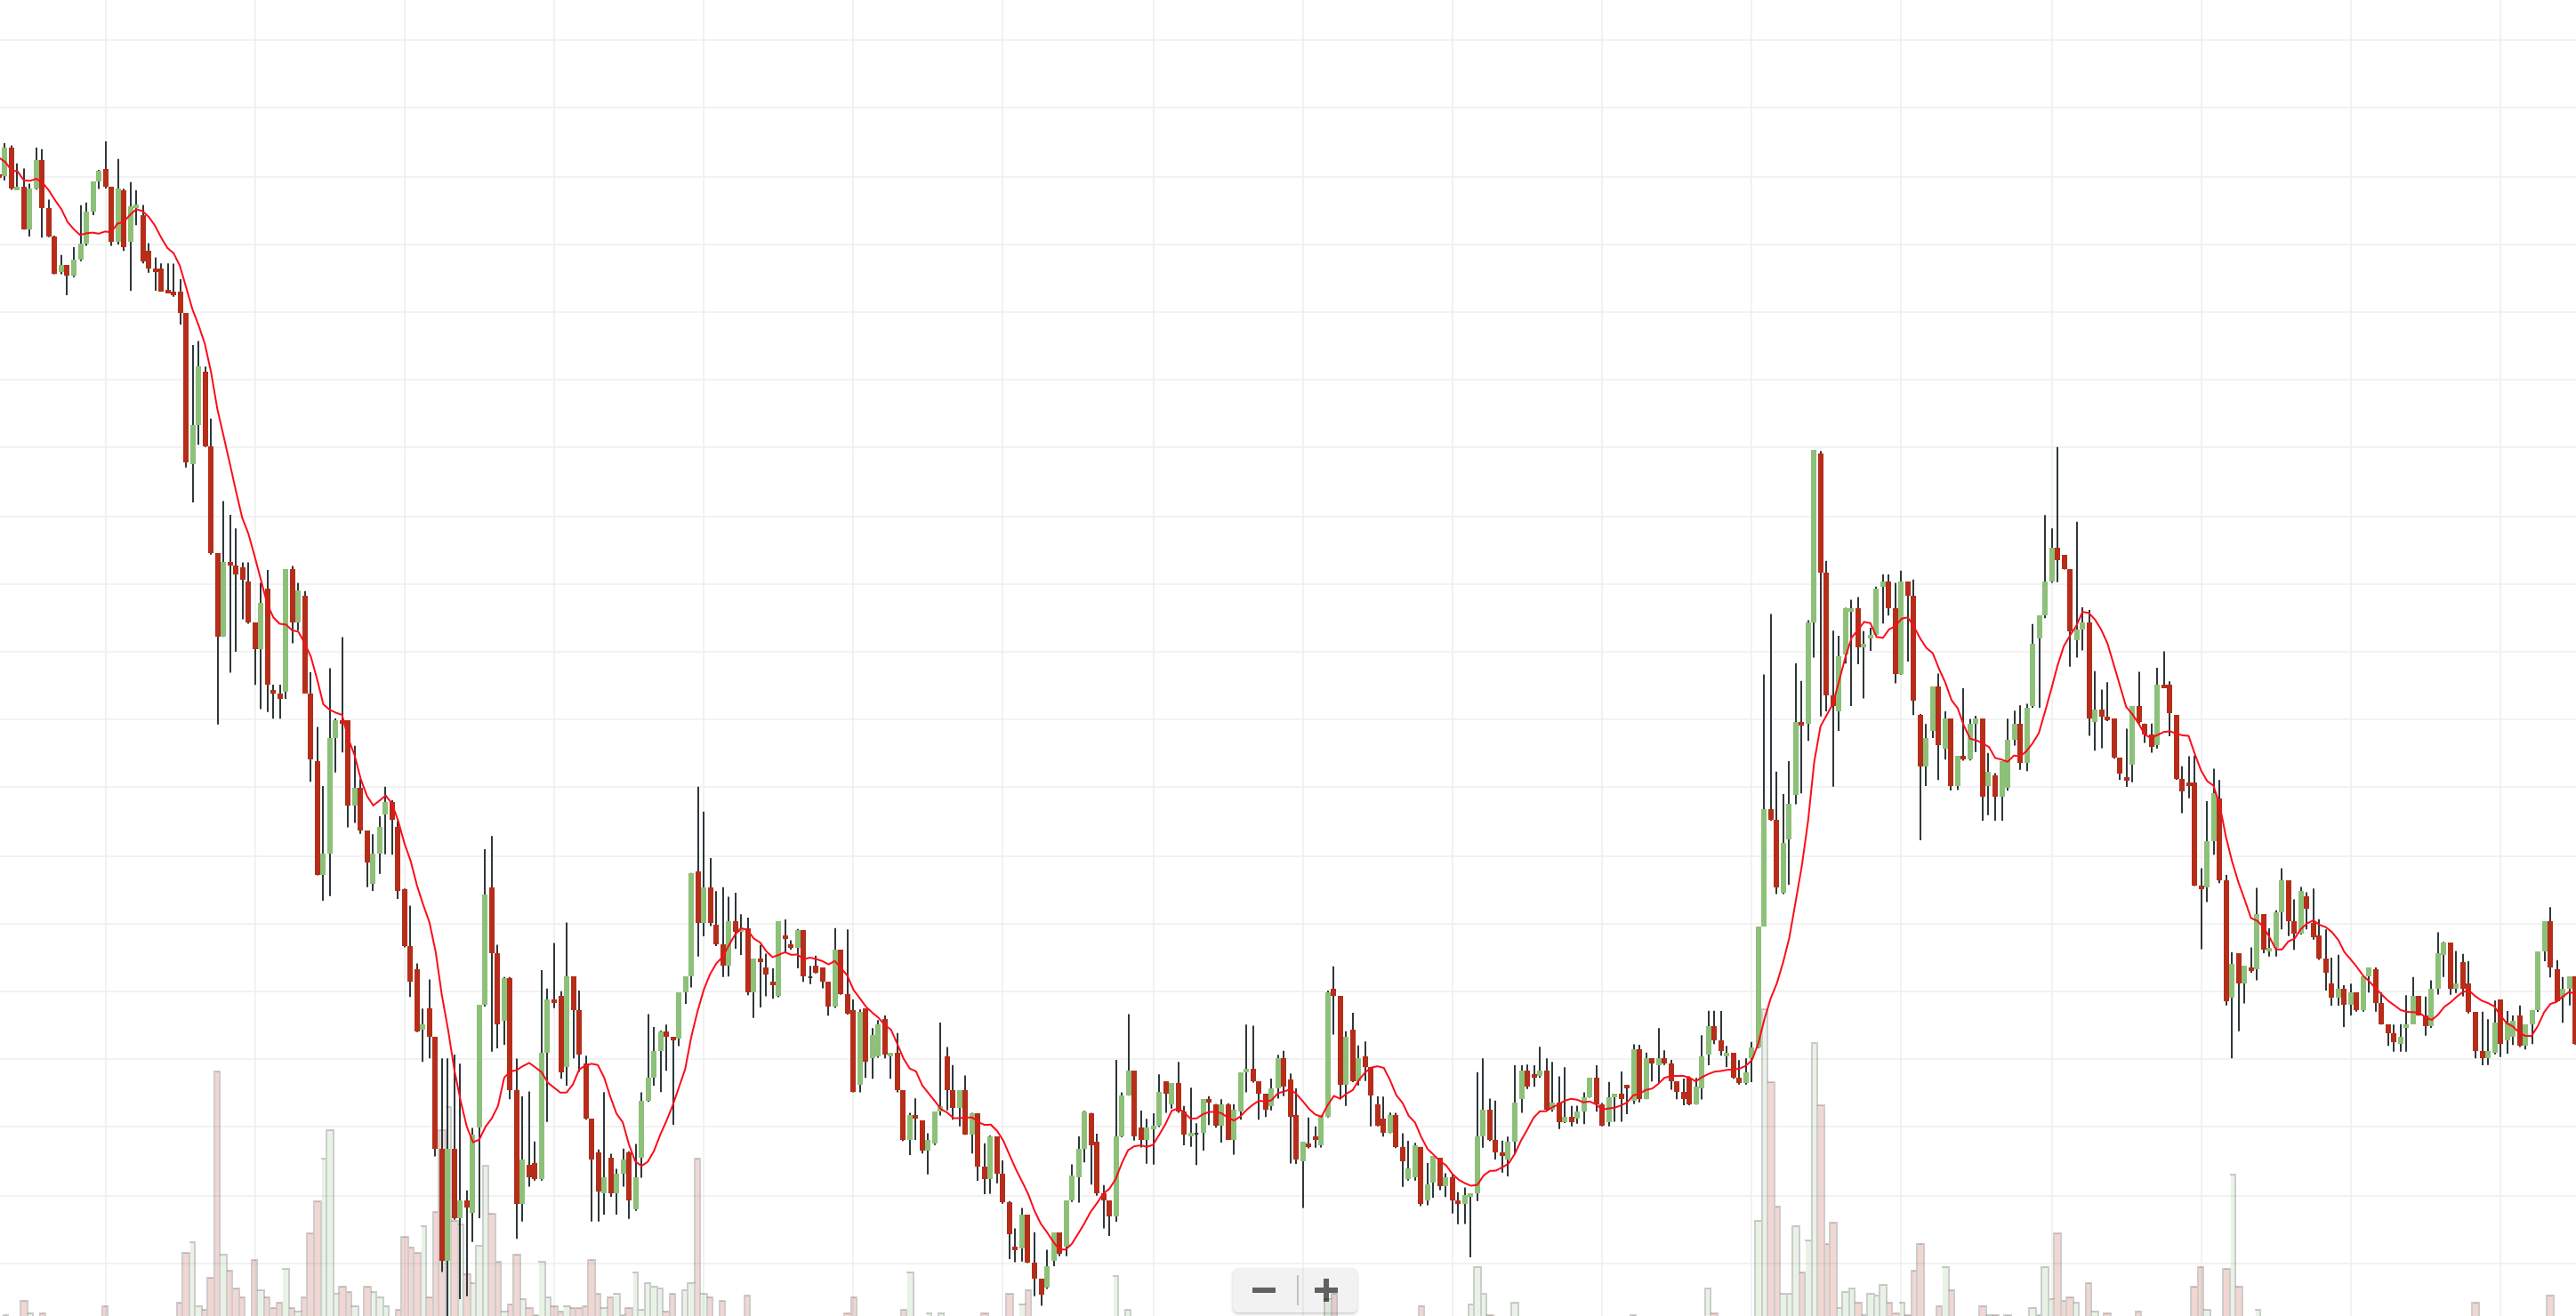
The red line is a moving average. I.e the average of the last 10 prices for the currency. You can see it is lagging, but does follow the price to some extent - it actually gives us a smoother line, and a general idea of the direction the price is moving it at any moment.
If we add a second moving average of the last 20 prices, that is analogous to our second shortest fishing line,
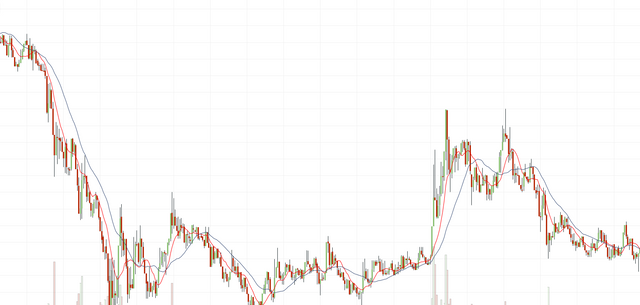
we can see that the new blue moving average lags the actual price more than the original (red) moving average of the last 10 prices. This is very interesting, because as with our fishing lines on the boat, each time our lines cross, we get a suggestion that there is a change in direction of the price. I.e if the price was trending down (as it is at the left of the graph) the 20 point moving average is above the 10 point moving average, but when the downward trend stops, you can see that the two lines cross each other, a little eratically - like our fishing lines getting tangled. Towards the right of the graph, about 2/3ds of the way along, the red line shoots above the blue one, as it follows the upward trend more closely. This is another indiciation of a change in trend.
It becomes useful when you don't know how the price will move in the future (you never do!). If you think about the fishing lines behind the boat, if you didn't know which way the captain of the boat was planning on turning, you could look at the fishing lines, and work out how the boat was turning based on how the lines were crossing each other. In a similar way we can use these moving averages to work out which way the prices of the currency is changing.
This principle is the basic principle of the Simple Moving Average Trading technique, others such as the MACD (Moving Average Divergence Convergence) takes the same principle further, and uses the "amount the lines has crossed" as an indictation of how strong the trend is. This is analogous to us using our four fishing lines to determine how strong our boat is turning, or indeed how long it has been turning for.
In CryptoCurrency trading, you can use this to determine when to buy and when to sell. Each time the 10 moving average crosses the 20, you may want to have a look and see if you think its time to trade. If 10MA goes above 20MA, it could be time to buy, and if 10MA goes below 20MA, it may be time to sell.
So there you have it. A contrived explanation of how going Tuna fishing is like trading crypto currencies!
(Note, please don't use this as your trading algorithm. This was intended as a bit of fun, as the two topics are currently on my mind. However, if you get rich from reading this blog, please share the wealth.