Basic TA: 4 Technical Analysis Indicators Used By Profitable Crypto And Altcoin Traders
There are two methods to analyze cryptocurrencies that allow you to come to an investment decision: fundamental analysis (FA) and technical analysis (TA). Fundamental analysis looks into the coin’s overall mission, utility, development team and more, to determine the token’s fair value. For technical analysis, it assumes that everything is factored into the market price and looks at price movements for a decision. For this article, let’s look into technical analysis.
Technical Analysis
It is both an art and science at the same time that looks into forecasting future prices of a cryptos based on historical performance. This trading method is not about ‘blindingly’ forecasting prices, but instead uses in-depth analysis using various indicators to confirm a ‘buy’ or ‘sell’ signal. By using historical market information such as time, volume and price, mass investor sentiments can be analyzed.
TA is not limited to cryptocurrency trading alone – it can be applied to most investments traded in an open market. To perform technical analysis, the most common chart setup is using a candle bar chart and along the bottom, showing the market volume.
Through technical analysis, both traders (and investors) can volatility, volume, relative strength of a crypto against the bitcoin market, and other see the market reaction when important events happened. There are many indicators that can be used when it comes to TA, but here are 4 of the main ones.
Relative Strength Index (RSI)
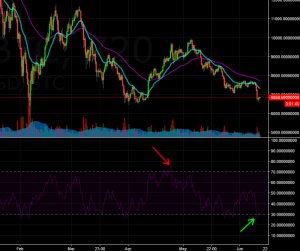
This tool is called a momentum oscillator and measures the price direction velocity and magnitude. The RSI, is an indicator for momentum where increases have higher RSI, and negative changes have lower RSI.
The upper line of the indicator is usually pegged at 70, the lower line at 30 and the middle would be 50 (represented as a dashed line). If the movement goes up above 70, it means it’s reached ‘overbought’ status. In the same way, if movement goes down and below 30, it means that it’s hit ‘oversold’ status.
Bollinger Band
This is technical trading tool conceptualized in the early 1980’s that gives a relative insight to highs and lows. It gives the trader a visual guide to alternative support and resistance point using the bands. Bollinger bands creates a visual representation of the price volatility and in turn the demand for the crypto market. Traders use this tool to see overbought or oversold sentiments and setting their ‘buy’ and ‘sell’ basing on the movements happening within the band.
Moving Averages (MA)
These are the oldest type of technical indicators used by both investors and traders alike. The movements shows a ‘smoothed’ view of the prices over time. There are 3 kind of MA that you can use: Simple moving average (SMA), Exponential moving average (EMA) and Weighted moving average (WMA).
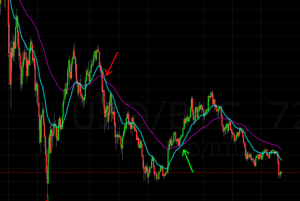
For cryptocurrency trading, one common strategy is to use 2 EMA indicators, one using a 20 period and the other with a 60 period. As they cross over, this would indicate a likelihood that the price would be going in a particular direction. Moving averages are also used as point of support and resistance.
Stochastic Oscillator
This is an indicator that focuses on the momentum of altcoin price movements. It’s similar to the RSI, in that it can indicate “overbought” or “oversold” markets easily.
This indicator is sensitive to market movements but by adjusting its time period, you can create a balanced indicator to help you time the market.
The theory behind is that if the market is trending upward, traders may close near the high point and will buy back in when it’s near the low point.
The most successful cryptocurrency traders use a combination of indicators to confirm their opinions before initiating a trade. Using Altcoin Fantasy, new traders can test out different strategies and technical indicators to learn which style of trading works best for them.

