Crypto Market Capitalization
Index - https://steemit.com/tax/@alhofmeister/3ibscz-accounting-and-finance-blog-index
Introduction
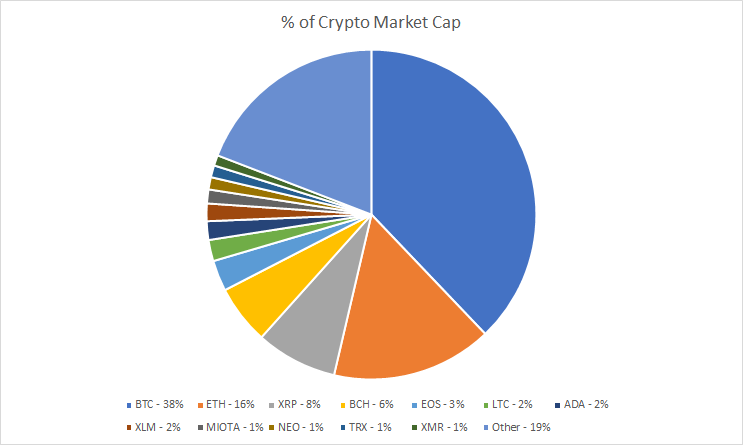
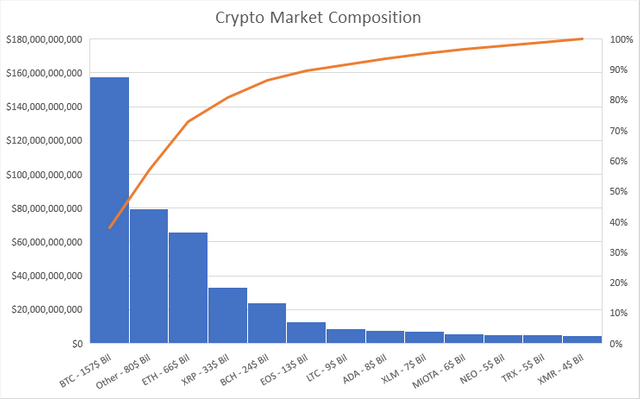
The purpose of this post is to create a visual representation of the cryptocurrency market to better demonstrate its composition. As demonstrated, the top 4 cryptocurrencies (BTC, ETH, XRP & BCH) represent over 67% of the total market cap. In the last week, there has been a shift away from the top 4 cryptos.
Graphs
References
https://coinmarketcap.com/all/views/all/
@contentvoter
A shift from the top four cryptocurrencies, however, does not mean there is less/more stability...or is there? Are the other cryptos gaining perceived or real value? And, are they improving their product? Speculating if you will, how much of the shift comes from being able to manipulate the more vulnerable cryptos?
I believe that there is likely a bubble in the crypto markets. I believe that a lot of the growth can be attributed to rampant speculation likely attributed to a lack of understanding of a proper valuation due to the new nature of the financial product. Developing a methodology for reliable valuation is a necessary hurdle cryptocurrency will have to overcome to be accepted by mainstream investors (as evidenced by the increased regulatory attention).
Your self votes will be countered by @sadkitten for 1 week starting Sunday, April 29th 2018, 6:59 because your account is one of the highest self voters. For more details see this post.
Coins mentioned in post:
Your self votes will be countered by @sadkitten for 1 week starting Sunday, April 29th 2018, 6:59 because your account is one of the highest self voters. For more details see this post.