Cryptocurrency Scanner in practice — How to use Big prints cryptoscanner
Strategies that use Big print
How to use the Big print scanner during trading and increase your profits thanks to Cryptoscanner tools? Observing large transactions (big prints) carried out on cryptocurrencies is extremely important for me. I use identical assumptions for the stock exchange. After all, in every market we have similar principles of using tools, and also the same motives that guide people who trade/invest. Today I will focus on explaining how to use the “Big print” scanner window when trading on cryptocurrencies.
What matters?
Let us evaluate the situation in the simplest way. You follow the quotes of a specific cryptocurrency. Are you interested in the level on which small traders open a position? The traders who statistically lose on the market?Do orders of, e.g. a fraction of ETH or a few pieces make an impression on you? I don’t think so. What is your reaction when you find out that someone has opened a position of, e.g. 500 ETH or 500 BTC? It is probably “WOW”. Someone has opened such a large order, so he must know more than you. In many cases this is how it is. Remember that in every market, big traders or investors do not like losing.Their decision to open a position does not result from:
- Boredom on the market,
- The need to have anything in an open position, or
- The call of others.
Of course, the big traders sometimes lose. You must also keep this in mind if you follow bigger traders when you trade. They can trade for a longer period (midterm or longterm). Therefore, consider the assumptions of stop loss. Position management must always be considered.
I don’t think you want to be in a losing group. This is why, in your trading, you should include observations of large orders that have been completed. Due to the fact that you are not able to analyze this manually, our Cryptoscanner is the right solution for you.
How do I use the Cryptoscanner window — Big print
First of all, I am interested in orders that deviate significantly from the norm on a given cryptocurrency pair. If I see orders in the transaction window, like the ones below:

Nothing attracts my attention. It’s just a simple transactions between traders, more often than not smaller ones, and usually at price levels that are not of interest to me.
The situation changes when there is a stronger move (up or down) or when we have some consolidation.

Suddenly, orders of $100–150k appear among smaller orders. Therefore, from larger traders who risk different amounts. It is important at this point to assess during which movement on a given cryptocurrency large transactions occur, and also on what side these transactions are set.

The above-mentioned large transactions took place during a decline, which we can see in the above chart. The orders that significantly stand out from the norm, and appear during each short raise of price, prove that the downtrend move can be continued.
Lanuch our Demo version: https://demo.algory.io
Big prints can be used while trading a few different strategies
Big prints should be analyzed with regards to how we use the information that comes from the size of transactions on the market. I personally consider large transactions in three different situations, thanks to which I know how to use the above information. Remember that this information does not always provide us with support of when to open a position. This information is very often also used to make a decision of closing the position you own.
If the following situations are on poor volumes, I stand aside. What does poor volume mean: it is volume that has not deviated from the average volume in the past minutes, hours or days.

Big prints create a “significant volume” that you can easily recognize on the chart, due to it standing out from the norm. As you can see in the chart, it is the level of trend reversal or the local extrema. The following strategies best suit me in terms of an hourly interval. However, you can also use them at lower intervals if you aim at other ranges of movements. For example, I used it at a 1-minute interval. In the same way, you can transfer it for 1-hour or longer intervals. It all depends on what strategy you will adopt.
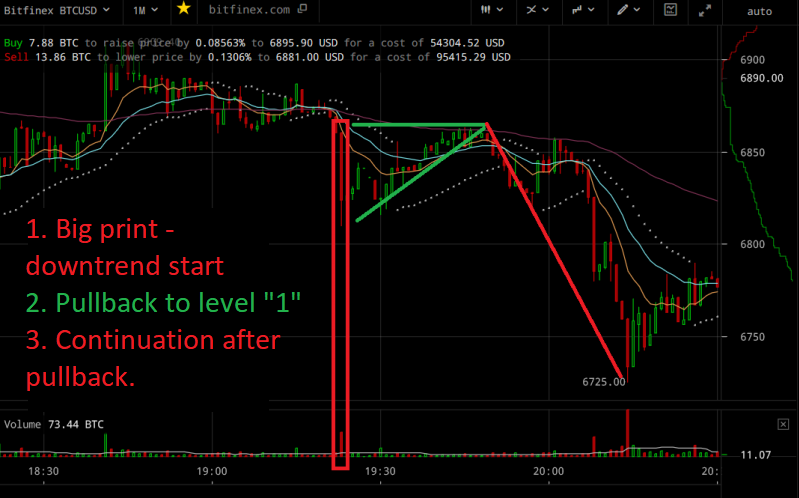
Trading on declines
When the first major red candle (1) appears, which occurs with large big prints, it is a good time to trade on declines. We are waiting for a pullback (2). It usually reaches the area of an breakdown (1). These regions become the level of resistance. From here you can take a short position with low risk, to which you can add when there is a rebound in the slump from level (1).
According to the situation presented below, analyze different intervals for e.g. BTC/USD, and then you can see how often you can trade on this strategy. The “big print” scanner will help you find good moments for pullbacks.
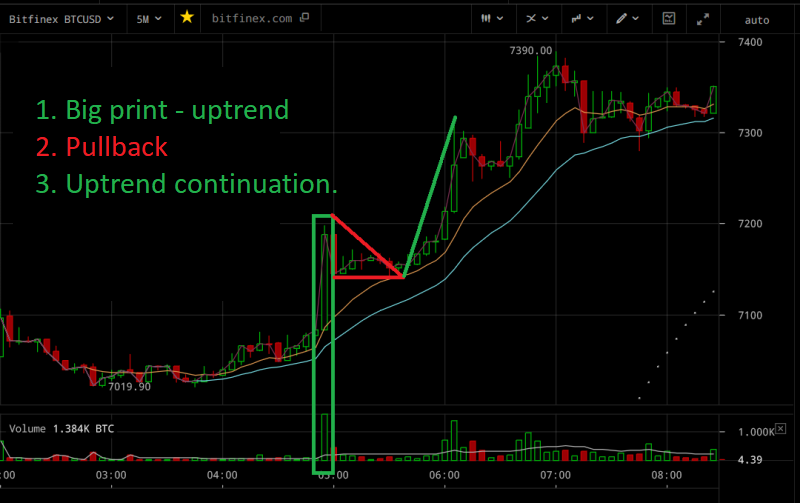
Trading on spike up
As with trading on declines, we trade the opposite way. When the first major green candle appears (1), which occurs with big prints, there is a good situation to trade on . We are waiting for a pullback (2). It usually reaches the area of breakout (1). These regions become the level of support. From here you can open a long position with a small risk, to which you can add when there is a high rebound from level (1).
According to the situation presented below, analyze different intervals for e.g. BTC/USD, and then you can see how often you can trade a certain system. The “big print” scanner will help you find good moments for pullbacks.
After a spike up or spike down
I recommend this strategy for people who have both experience and a feel for the market. Basically, one is related to the other. This is a trading based purely on human emotions and is focused on a quick rebound from a local bottom or top.
The cryptocurrency market, especially the holding of positions, has brought very large profits to many people. However, holding a position is not tantamount to the fact that such people are good traders.
Very often, instead of making profits and enjoying the money they earn, people try to trade with big capital. Big prints usually appear on the local extremum. We can observe a significant increase in the volume on it, as well as a specific layout on the candle chart. Observe the quotation window during very strong declines. Why? Because thanks to this, you will notice how often at the end of a strong decline very large orders in sales occur, which are then quickly filled and result in a dynamic rebound.

These large orders are usually orders of traders who do not have a special trading strategy behind them, and therefore they did not close the position when it was necessary to do it in order to only suffer a small loss. They closed the position due to panic, thinking: “I will close the position so that at least something remains of it”. I would not want you to see the last strategy as a manifestation of pride and superiority over anyone else. However, the sad realities of the crypto market are that experience, calculation and the proper management of a position, as well as one’s own emotions, count in trading.
Summarizing
Big prints are not a strategy itself. It does not work in such a way that a large order appears in the trend and you already know that you have to open a long or short position. It is a very good addition in the process of making decisions about the opening/closing of your position. It is also a good indicator of when it is worth being out of the market and waiting for interest from bigger traders.
You can check “Big prints” scanner window on: https://algory.demo.io