Zilliqa: Determining Key S/R Levels
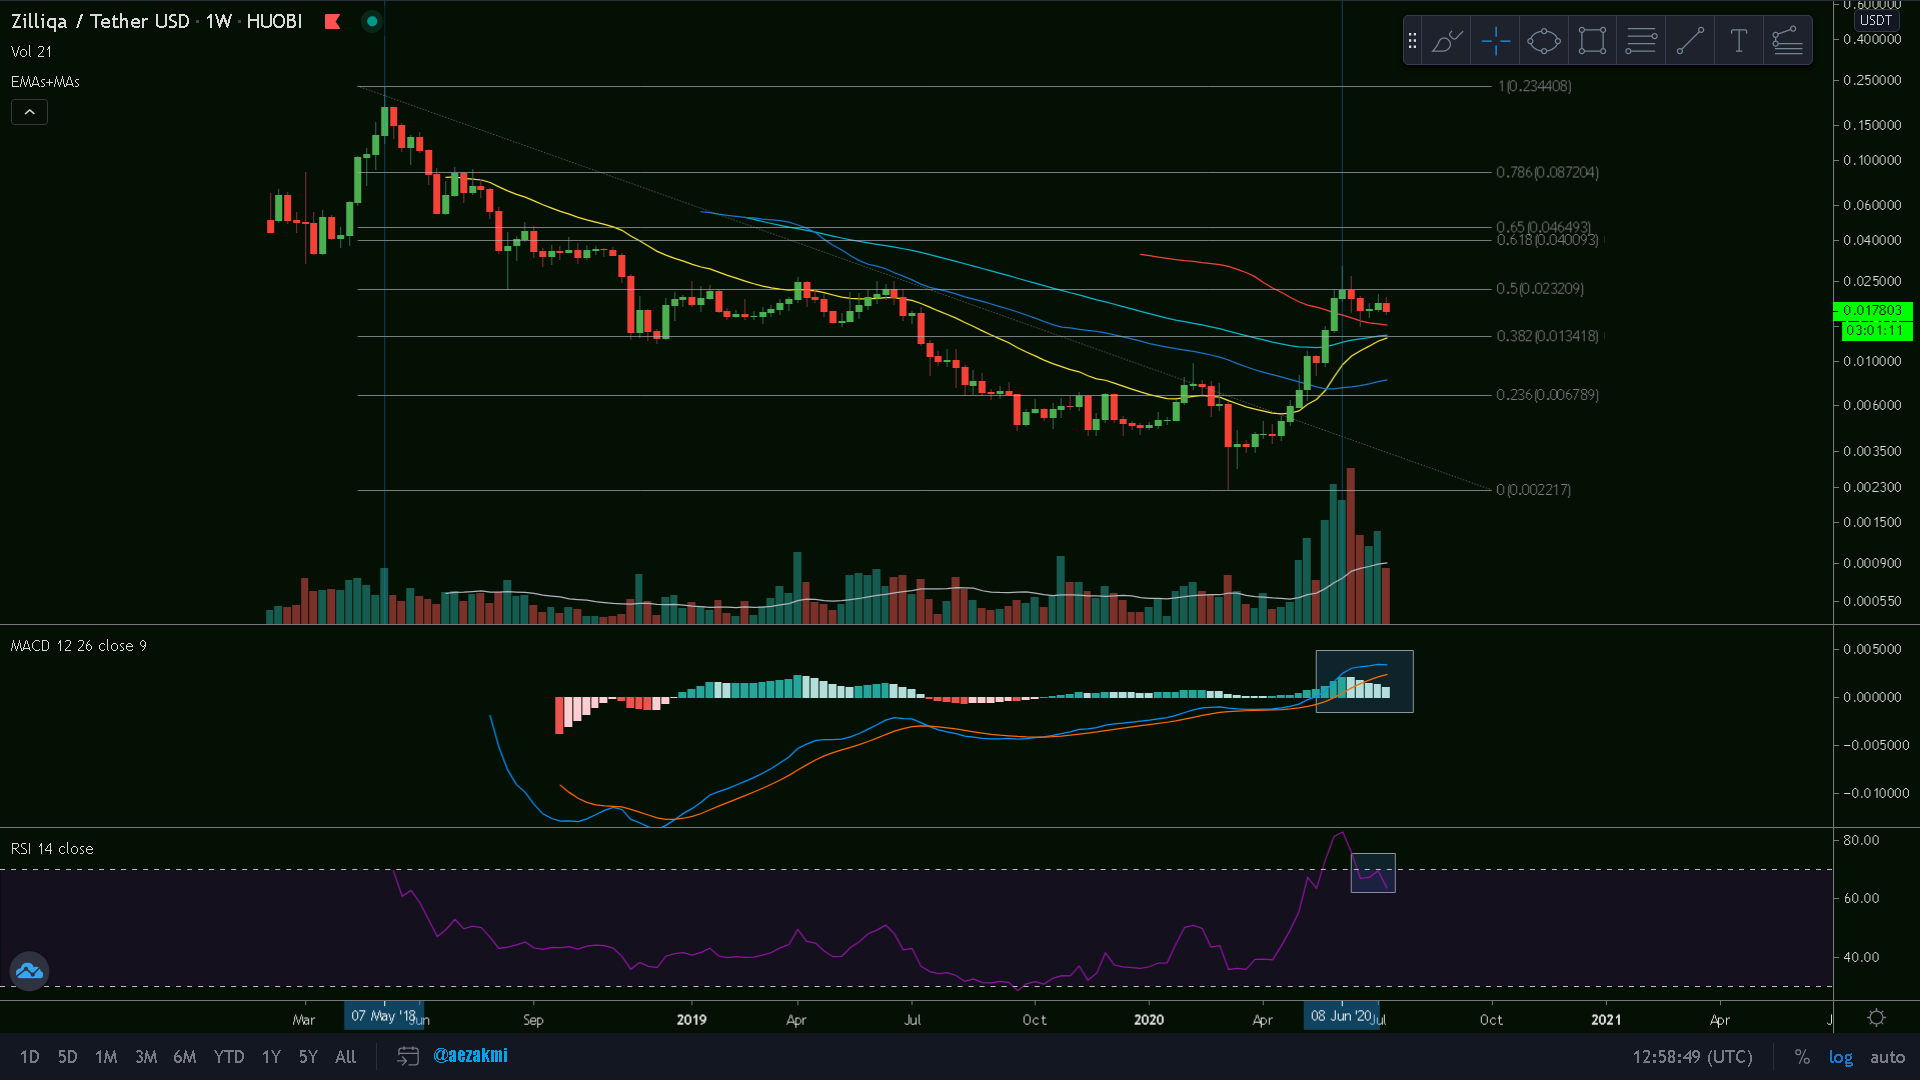
ZIL/USD Weekly Chart
Considering the Fibonacci retracement levels on the whole two-year-long downtrend, we can see that after the amazing +1200% recent rally, Zilliqa reached the 0.5 level, where it saw a harsh rejection. This 0.023-0.025c area is in fact a very important resistance level, marking in the past some other reference points (see chart). The bulls are currently fighting to maintain the 0.0178 level, but looking at the descending volume, the decreasing MACD-Histogram and the RSI rejection at the upper reference line, one might assume that the 0.382 Fib. retracement is our next stop. At 0.0134c (0.382 Fib.) are also the 21 EMA (yellow) and 55 EMA (blue), which will fortify the support strength.
A great outcome for the following period would be if ZIL corrects to the 0.382, bulls re-enter the market and we regain momentum to revisit the 0.5 level.
Ctrl + Click here to enlarge the image in a new tab (steemitimages)
ZIL/USD Daily Chart
On the daily, a descending resistance line has formed, pushing us down. The bulls lost the 21 EMA support (yellow) and are currently trying to hold the 55 (blue), but - same as on the weekly - we have a decreasing MACD Histogram, with the MACD about to enter the negative area and the trading volume is also shrinking.
If we also lose the 0.236 Fib. retracement (March low to June high), we might test the 0.382 and the 200 day MA (grey) in the next period.
Ctrl + Click here to enlarge the image in a new tab (steemitimages)
