Update On Wanchain (WAN): Following ICON's Lead
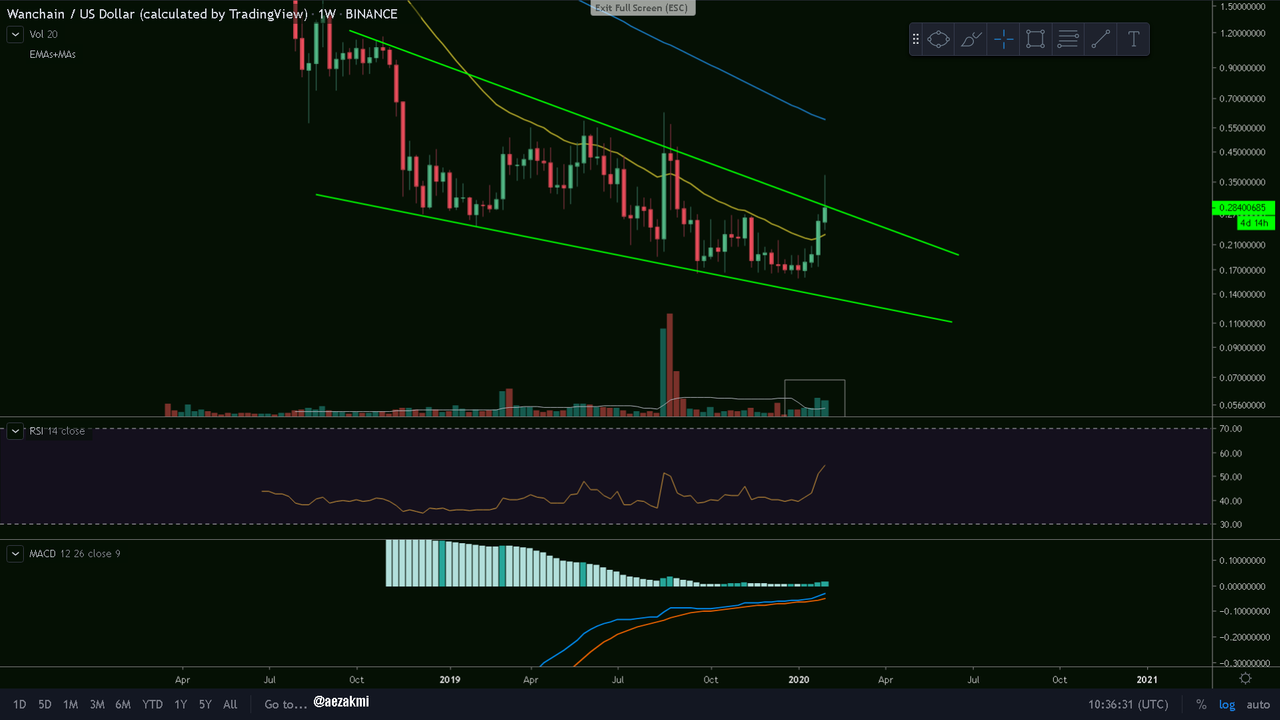
WAN/USD Weekly Chart
Following ICON's lead and probably influenced by the Cointelegraph report (link here) , Wanchain also had a massive price spike this week. Unfortunately for the bulls, we saw a harsh rejection and are currently at the top line of what seems to be a 15-month long descending channel. For the bulls to regain their optimism, we need to get of this channel and close the weekly candle above 30 cents. The trading volume is still relatively low and the MACD and RSI are neutral.
Ctrl + Click here to enlarge the image in a new tab (steemitimages)

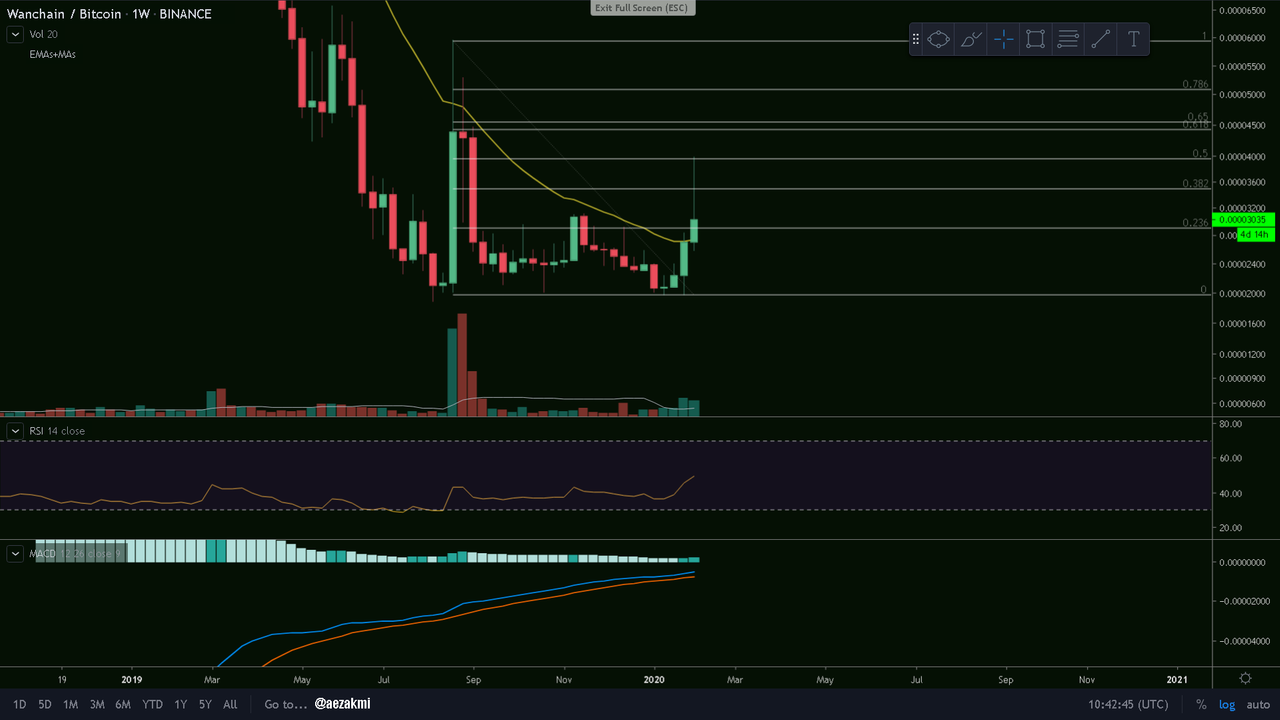
WAN/BTC Weekly Chart
We finally broke the 21 weekly EMA (yellow) that was pushing us down forever. Actually it's the first time we open a weekly candle above this 21 EMA, which is quite important. Moving forwards, we had a major spike on this chart too, but got rejected exactly at the 0.5 Fibonacci retracement. The RSI and MACD are neutral, like on the /USD pair. What's of great importance now is to close this weekly candle above the 21 EMA and I believe we've got high chances in doing so.
Ctrl + Click here to enlarge the image in a new tab (steemitimages)


Thanks for reading and safe trading!✌
If you find this post useful, please:

As a follower of @followforupvotes this post has been randomly selected and upvoted! Enjoy your upvote and have a great day!