Update On ICON (ICX): Takeoff And Next Resistance Levels
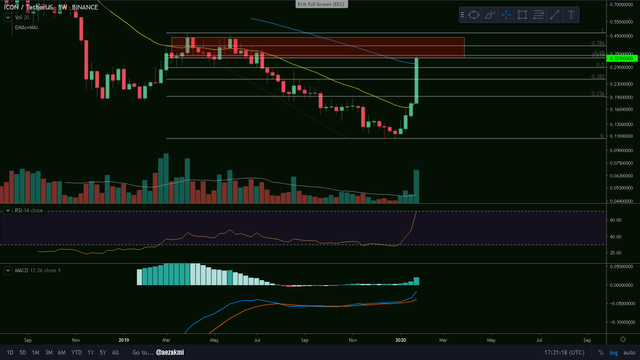
ICX/USD Weekly Chart
They say we've broken the resistance and it's time for the bull run, but I wouldn't be so sure about it. We have indeed pierced through the 55 weekly EMA (blue), which itself is a huge accomplishment and furthermore we have the MACD taking off, but the RSI just reached the upper reference line and we're at the golden pocket area (0.65-0.618) on the Fibonacci retracement - which represents the beginning of a strong resistance level. This resistance level appears on the chart as the red rectangle and marks the 0.33c - 0.43c area. After we get to see Icon above this level, or even better above 50 cent (lol), I might get a little bullish.
Ctrl + Click here to enlarge the image in a new tab (steemitimages)
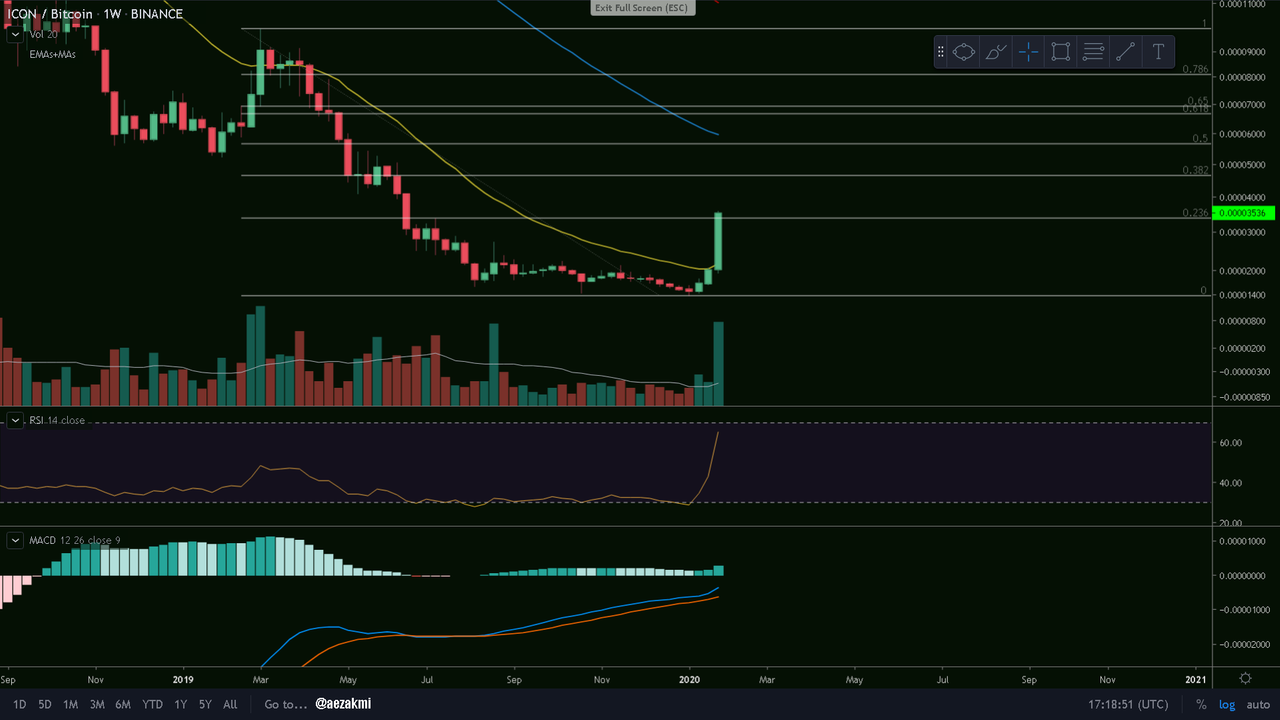
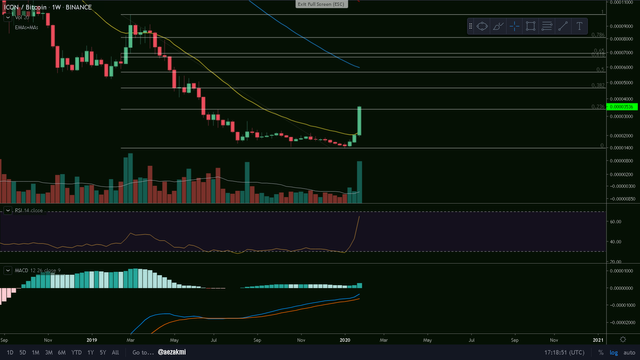
ICX/BTC Weekly Chart
Using the Fibonacci retracement tool on the last major movement (in this case - the 2019 drop), Icon has just reached the 0.236 retracement, after a crazy 150% month. We have the MACD slowly detaching from the signal line and the RSI almost reaching the top reference line, which might be the time when the bulls will react. Closing above the 0.236 and bouncing at it in potential correction, would be very beneficial for us.
Ctrl + Click here to enlarge the image in a new tab (steemitimages)


Thanks for reading and safe trading!✌
If you find this post useful, please:

Update on ICON: zero f**ks were given by now: