Bitcoin To $10800 Soon?
BTC/USD Weekly Chart
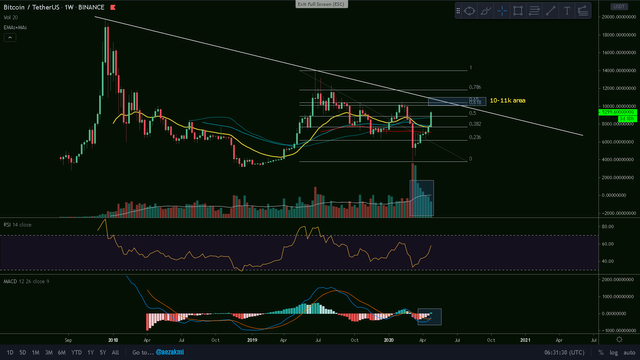
Bitcoin pierced through the 7800-8000$ resistance like it wasn't even there and it looks like we're heading towards 10000$. Now, why is this level important? First of all, we have the 0.618 Fibonacci retracement right there, with the golden pocket extending to 10400$. Secondly, we have the previous peak from February 2020 at this level, so the possibility for a double top isn't excluded. Furthermore, and perhaps the most important of all aspects is the descending triangle line, that lies around 10800$.
Looking at the indicators, we have the RSI in the neutral zone - nearing the previous top from February, the MACD indicates a strong bullish cross, with a lot of momentum. The general trading volume is however decreasing.
Based on these factors, I'd say that if this wild run continues, we might see BTC soon reaching the Fib. golden pocket (10000-10400$), with possible wicks reaching the descending trend line. I'll be looking to short it around these levels, with a stop loss above the trend line, around 11000$.
Ctrl + Click here to enlarge the image in a new tab (steemitimages)


Thanks for reading and safe trading!✌
If you find this post useful, please:

As a follower of @followforupvotes this post has been randomly selected and upvoted! Enjoy your upvote and have a great day!