Update On Chainlink (LINK)
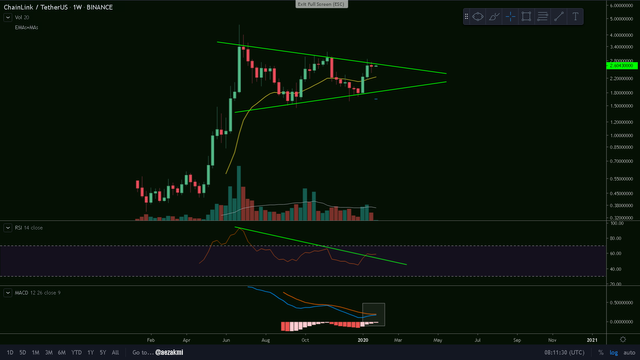
LINK/USD Weekly Chart
We've reached once again the top of the symmetrical triangle and are about to see if we'll get a further rejection or a breakout. So far, the RSI broke the descending resistance line and the MACD-Histogram indicates a pretty strong bullish momentum. The MACD is also about to cross the signal line, or we'll get a nasty rejection like it happened previously in November. The trading volume is lower this time, so I'm considering a rejection is more likely, plus a revisit at the 21 weekly EMA (yellow).
Ctrl + Click here to enlarge the image in a new tab (steemitimages)
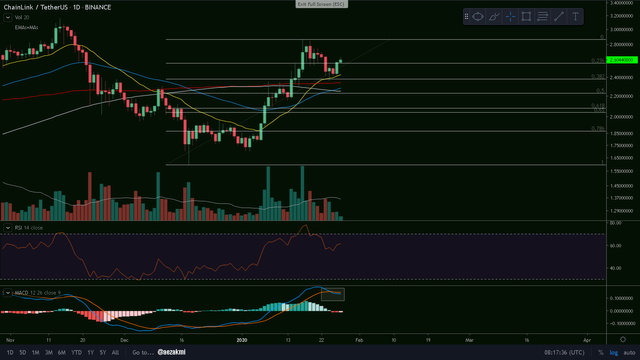
LINK/USD Daily Chart
Looking closer at the /USD chart, we can see the support levels at the 0.382 and currently 0.236 Fibonacci retracements, together with the 21d EMA (yellow). However, the trading volume is drastically decreasing and the MACD indicates a bearish cross. It is possible for us to get a double top pattern, with the RSI indicating a bearish divergence, which on the weekly chart will appear as a small bull trap. That's when the bears might make a significant move.
Ctrl + Click here to enlarge the image in a new tab (steemitimages)
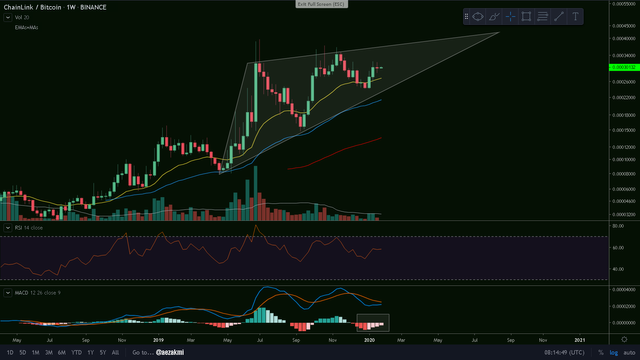
LINK/BTC Weekly Chart
On the /BTC chart we still have some room left to reach the top of the ascending triangle. Despite the MACD-Histogram indicating some bullish momentum, the RSI is continuing the downtrend and the average trading volume is decreasing. In the upcoming weeks we might have ascending movements, but first of all we have to see what Bitcoin will be doing, which by the time of writing is slightly increasing (8625$).
Ctrl + Click here to enlarge the image in a new tab (steemitimages)


Thanks for reading and safe trading!✌
If you find this post useful, please:
