STEEM (STEEM/USD) Top-Down Technical Analysis - May Go For New Highs Soon
Hi Everyone
I've been a technical trader for quite a while now but recently added many cryptocurrencies to my portfolio. I don't really get too involved in the fundamentals - I trade mainly on higher timeframes and today I want to break down the STEEM/USD chart with a quick top-down analysis.
Monthly Timeframe
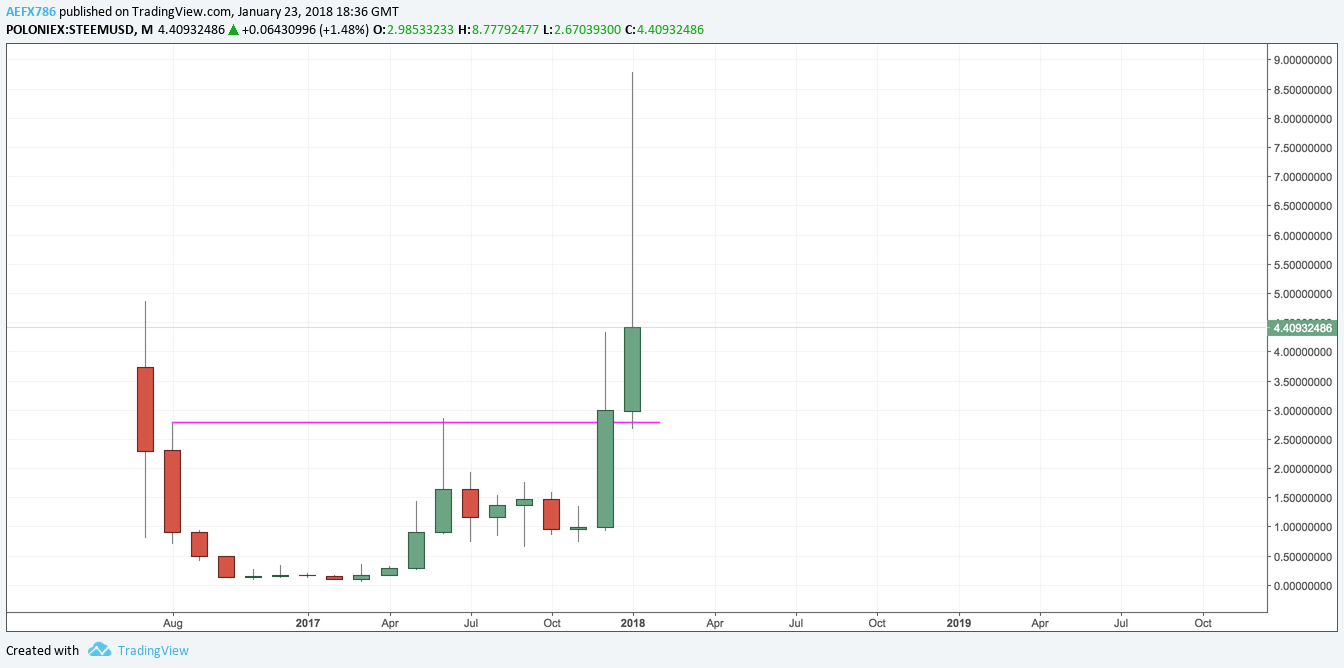
At the end of an impulse wave comes correction and that's exactly what we can see from July 2017 through to November 2017. The market consolidated whilst finding support at the $0.70 level.
From December 2017 came the start of the next impulse wave. With support from the $0.70 support level, the December 2017 candle successfully broke and closed above the $2.70 previous resistance level. It actually went as high as $4.35 before dropping back and closing the month at $3.00 on the dot.
Tip: When market breaks a strong resistance/support level, always look for the possibility of a 'retest' before continuing in it's direction.
This month started with a retest of the $2.70 previous resistance level and it has held strong as support. This support helped to push price up and the continuation of the impulse leg went as high up as $8.75 before finding resistance. The market has since pushed this pair back down and it is currently trading at $4.41, creating a very large bearish wick above the body of the green candle.
If the month closes with such a long wick, we are unlikely to break the ATH of $8.75 and instead we will most likely begin a correction back to the recent support shelf at $2.75 before the next impulse to the upside. Ideally, we want to close this month above $5.00 to continue our impulse wave into February before the next consolidation period.
Weekly Timeframe
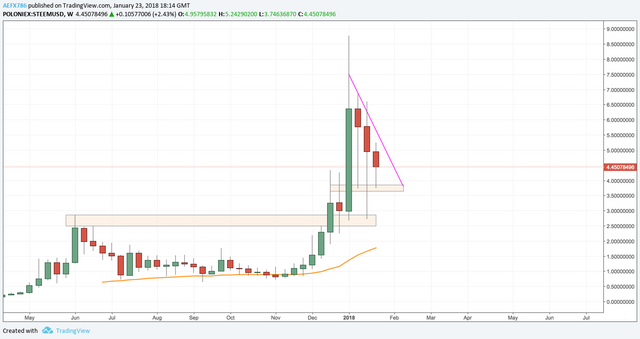
We have additional confluence of the $2.70 - $3.00 support level holding as strong support as the Weekly EMA50 draws in closer to that level. As it climbs closer to that level in the coming weeks, should price fall to those levels we are likely to see strong support and very little opportunity to fall below it.
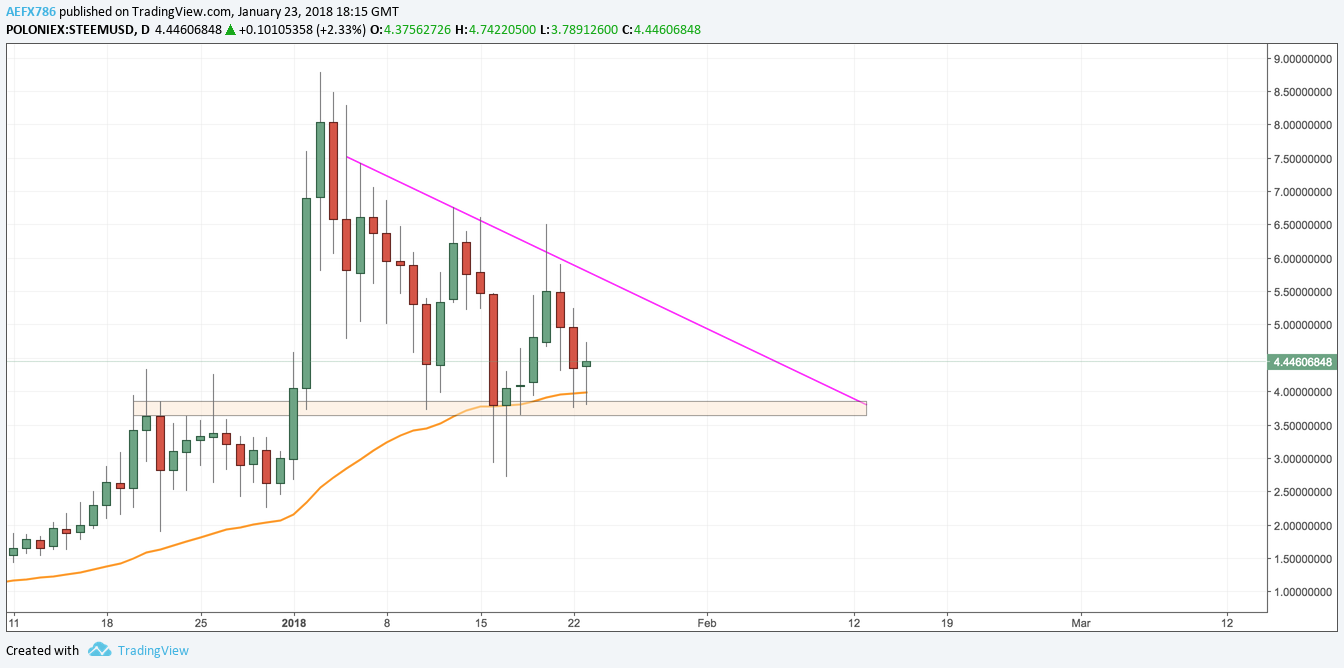
Daily Timeframe
4-Hour Timeframe
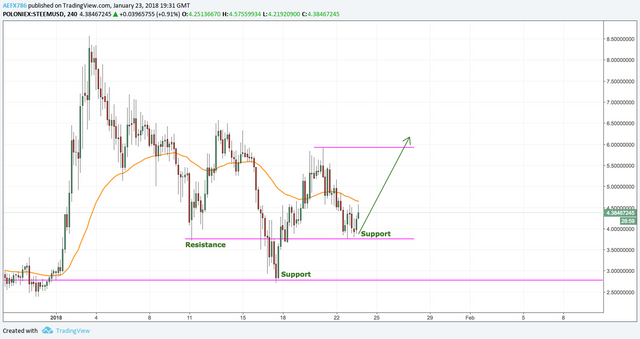
If price can break and close above the 4-Hour 50EMA, which I feel is possible in the coming days, this will give extra support for price to make another leg up and the immediate target would be to make a higher high above $5.90.
I think we have enough confluence to say that price will be going up soon and around Mid/End of Feb we will see price retest of the highs of $8.75.
I hope this analysis has been helpful. Don't forget to vote if you liked this top-down analysis and would like to see more like this. I look forward to any comments :)
Just a quick update, as you can see from the 4-Hour chart, price quickly accelerated shortly after I posted this blog post and hit our target :)