My 2 Cents Of Crypto - 2/3/2018 - BTC/USD Analysis
BTC/USD Update. Let's review both scenarios: Positive and Negative.
I will start with a negative scenario.
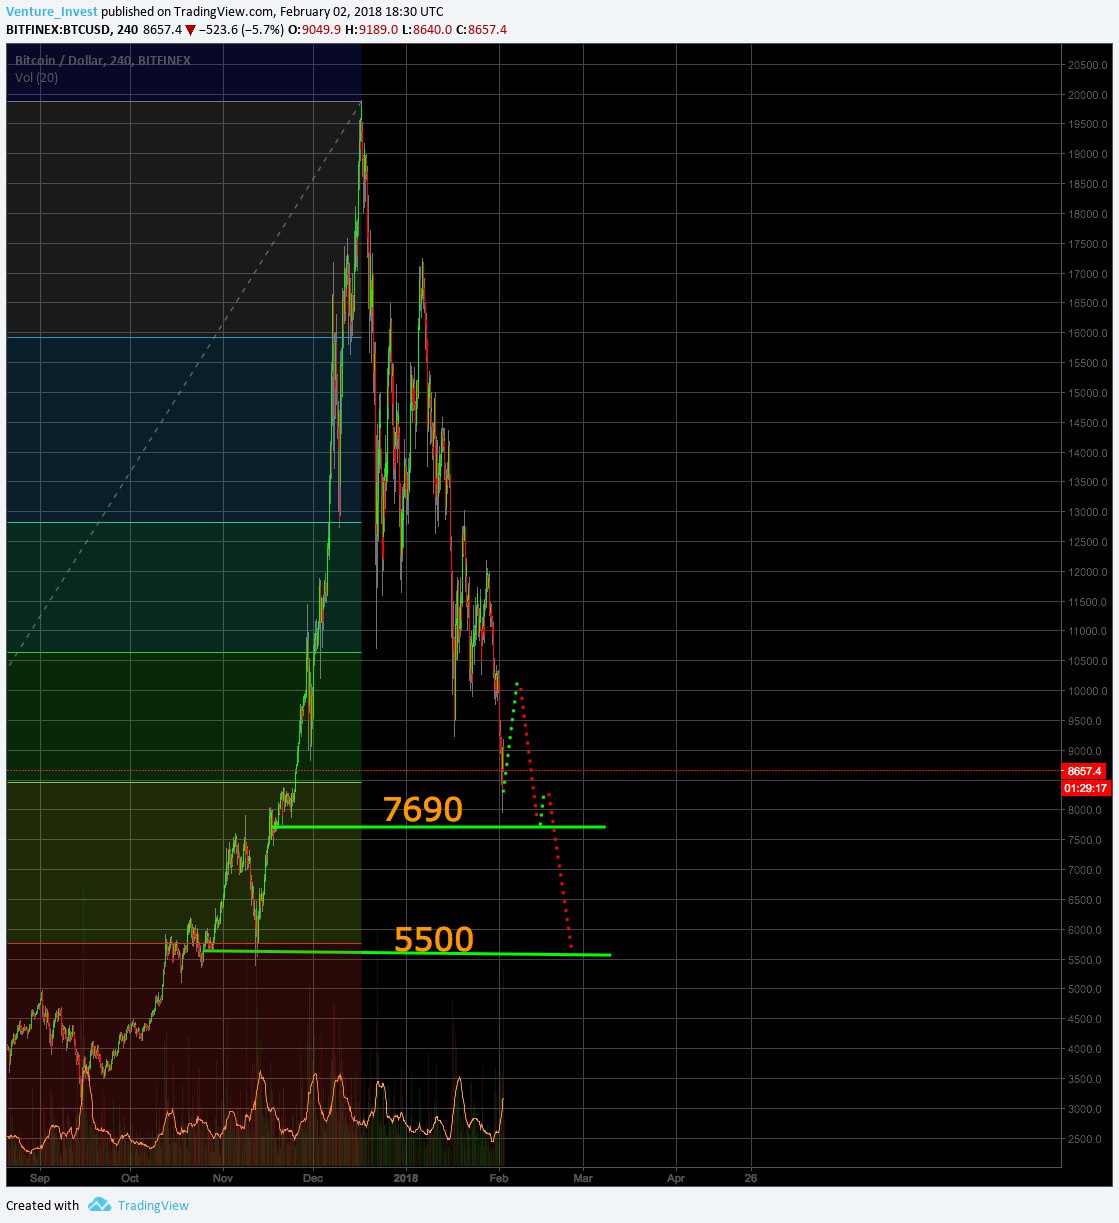
Let's assume that due to the pressure of the G-20 countries against (South Korea and China, plus recent rhetorics from India) will push Bitcoin even further down.
Then our next resistance lines are: 7690, 6200 and 5500.
I made partial BTC purchases at 8600 but I am still waiting for the further fall.
However, in a short-term period I expect to see some recovery, possibly up to 10,000 #USD as we can clearly see a new resistance line at that level. After that, if we can't go over 10,000 then we will move further below 8000 to 7600.
5758 USD would be a perfect #BUY, however I am not sure if the price will go THAT LOW. It would be smart to set some of your buy orders along that price channel.
Let's take a look at positive Scenario
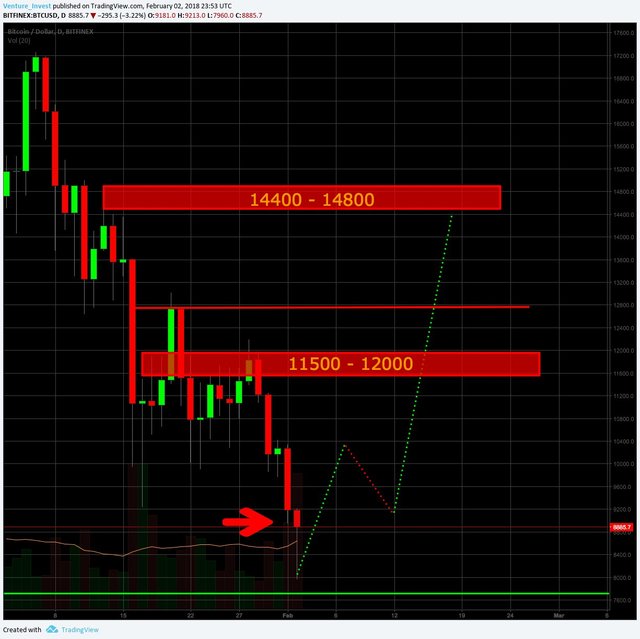
In technical analysis, there is a reversal pattern indicator which is called "Hammer". Some people prefer to call it "Hammer" only if the body candle is green (not red, like in this case) however we can't completely ignore this signal.
Hammer is a strong Bullish indicator, which might signal reversal movement, possibly towards 10,000 USD. It's easily observable on 24-hour candlestick. I am still very skeptical over the bullish market but we might see some short-term recovery. What are the resistance lines?
Currently, the nearest resistance lines are: 10271, 11201, 11700 and 12739.
In the nearest 72 hours I will be able to tell you if we should wait for negative or positive scenario for a mid-term.