3 & 5 wave structures, trends & corrections, trading the impulse, and my view on Elliott Wave!
Every aspiring Elliottician has the 1-5 ABC count burned in their brains ever since they read the overview in babypips or other basic articles on the theory! I firmly believe drawing 12345ABC all over the charts on every time frame will start to frustrate you. I know this based on personal experience, and I'll touch on that in this post! The one thing we can all agree on is that the markets move in waves, but can we all agree on the way to read into the waves? Probably not, there are many different theories that suggest a way to identify the waves.
Wyckoff theory with the waves of distribution and accumulation...
Dow theory which suggests that markets move in 3 wave up and 3 waves...
Elliott wave theory, where you have 5 waves when trending and 3 waves when correction for the "perfect elliott cycle" plus a good amount of rules and guidelines that will help with identifying the patterns...
What I've come to find is that nothing is perfect. Motive (trending) 3 and 5 wave structures both exist. I'll be going over them in this post! Current analysts owe a lot of credit to the people before us that had to chart free hand on paper & make a call on a rotary phone to place a trade. They gave us a treasure map with all the right directions to get to the land of milk and honey.
In this post I'm going to go over a few 3 & 5 wave structures both trending and correcting, some alternative ways to look at them, and how to know if the market is trending or correcting!
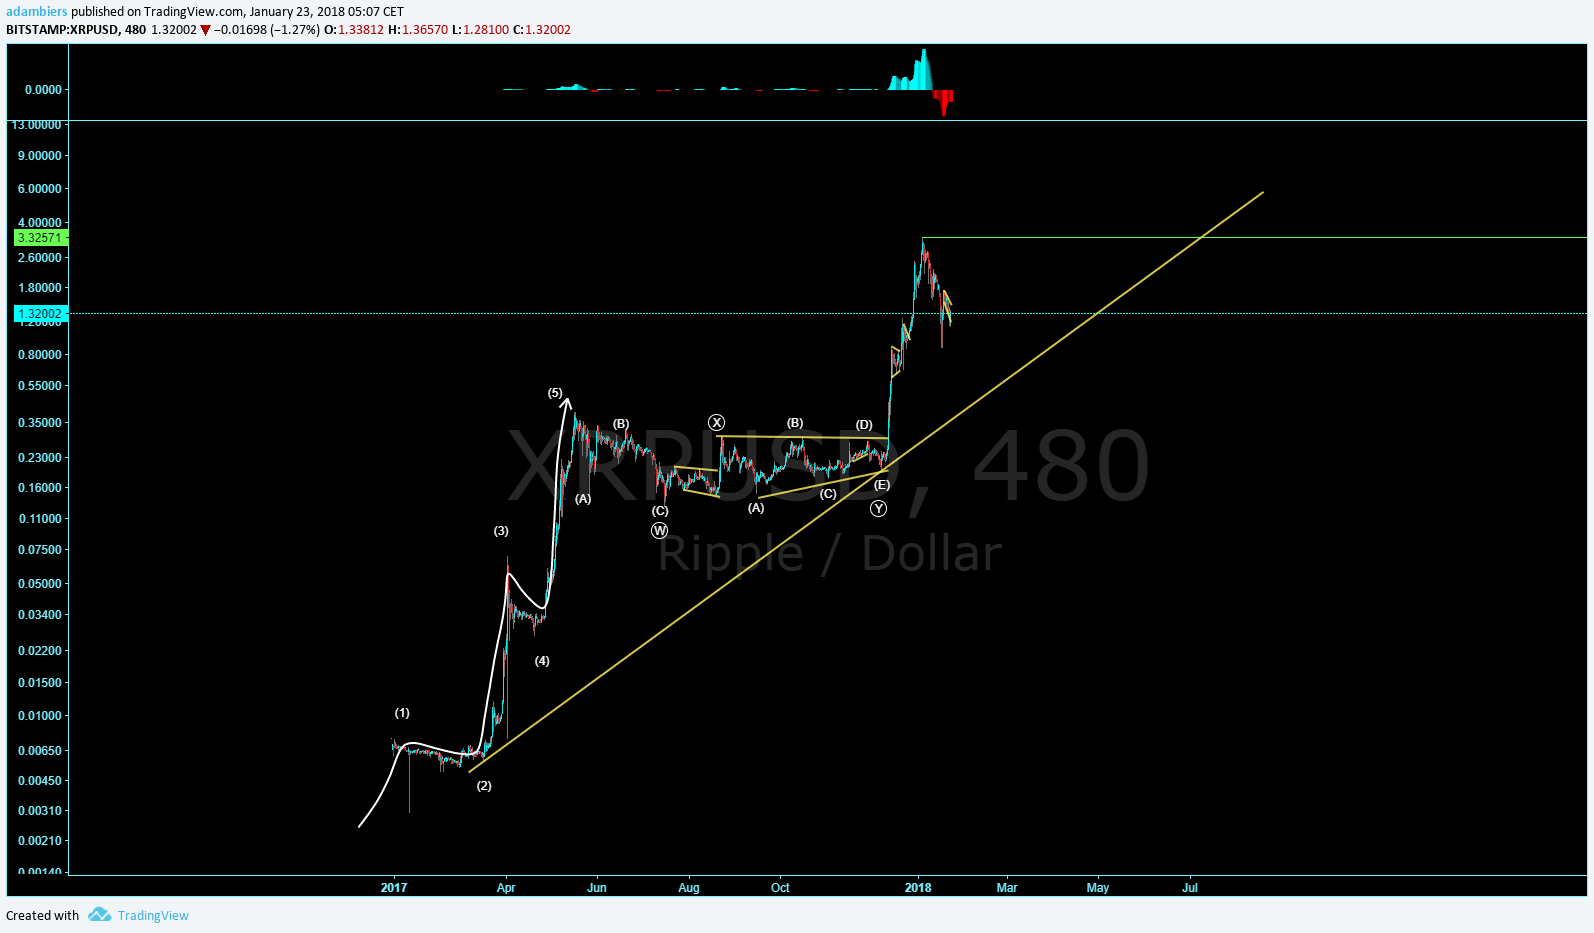
The first impulse on #XRP was a solid 5 wave structure that peaked around $.40. After that we went into a #doublethree corrective structure.
Many people in message boards we're saying this was dead, it's not going anywhere anytime soon! This is where reading into the structure will help ya'!
Let's take a look at the next 5 wave structure in this chart. The next one isn't a trending structure, but a corrective structure!
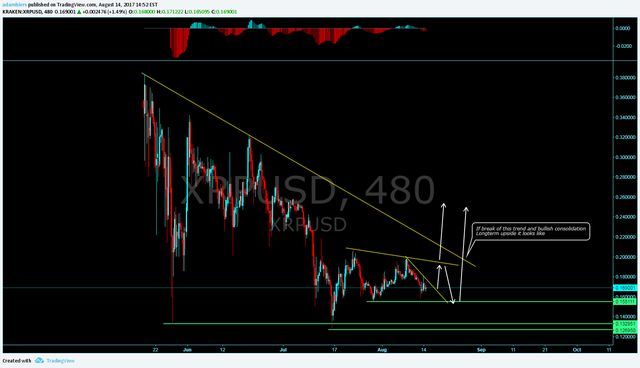
This was the setup that started it now take a look at the piece that came after that. The #triangle!
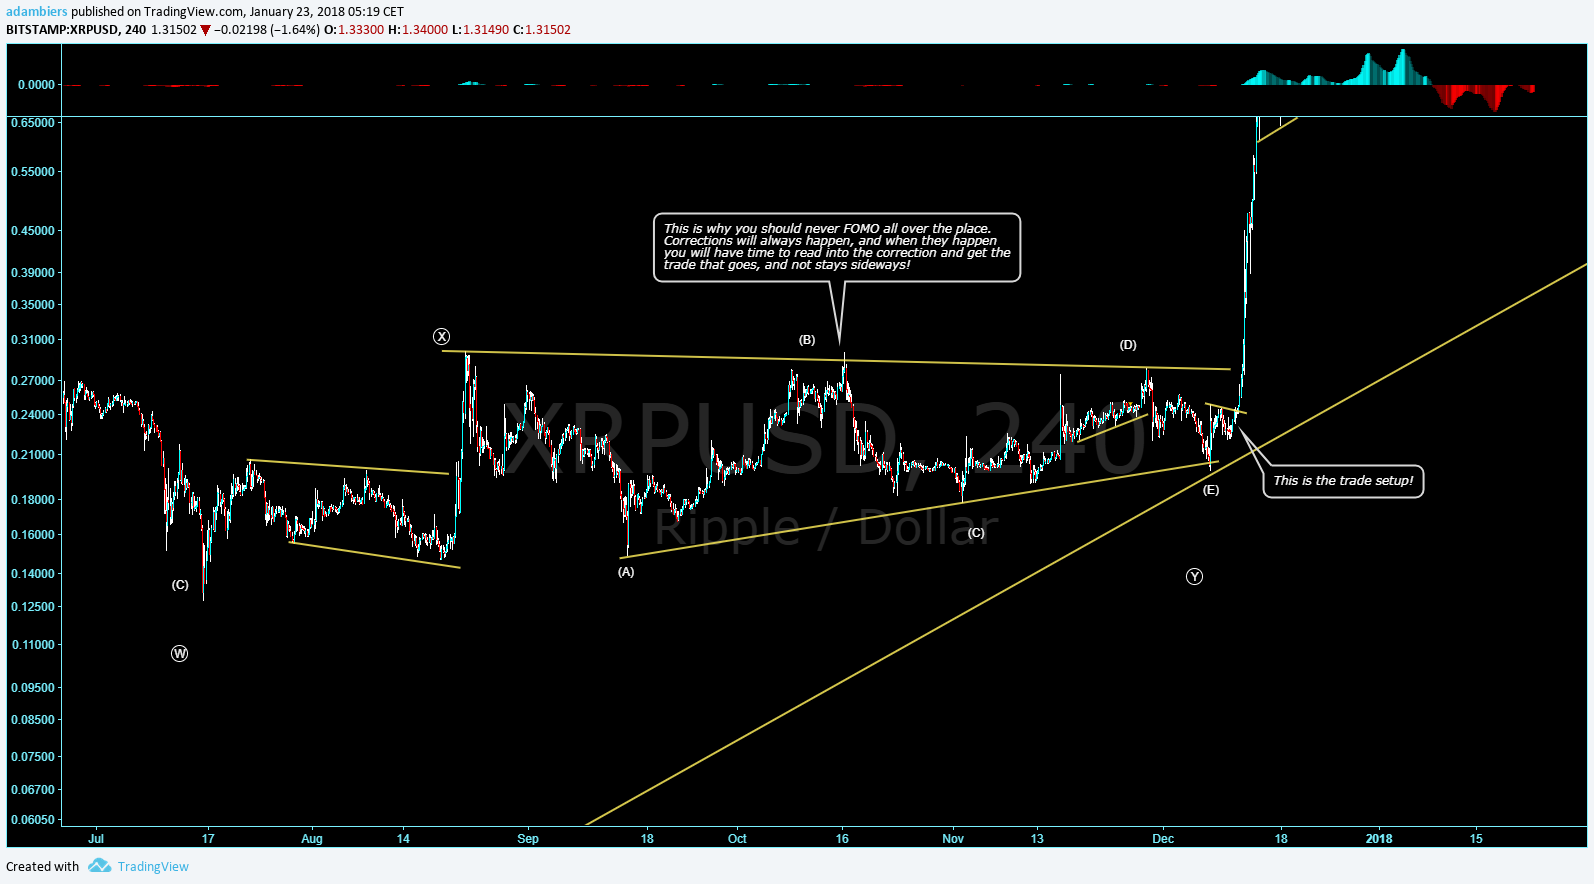
After the 3 wave impulse/connecting three we started trading within a trend where the bottom and top trend lines start converging!
It's almost impossible to forecast a triangle will happen, but as it starts happening you should be able to see it after the 3rd wave doesn't give you the impulse! Especially if you have converging trend or something that fits the description of a triangle.
Types of triangles that happen: #ExpandingTriangles, (expanding trend, can also be expansion on a flat) #SymmetricalTriangles (contracting trend) and #BarrierTriangles
I realized it was a triangle at almost the last minute, but was able to setup an order on XRPETH at the low of the chart.
What happened after the corrective triangle completed!? A 1000%+ impulse! It seems like those are the moves that make the money!
Triangles I haven't noticed a ton, but there is one on the EURUSD chart and also the Copper charts! Check em' out and leave a comment if you see where they are! :)
Let me show you an alternate count on this, is it possible it's just a big three wave structure?
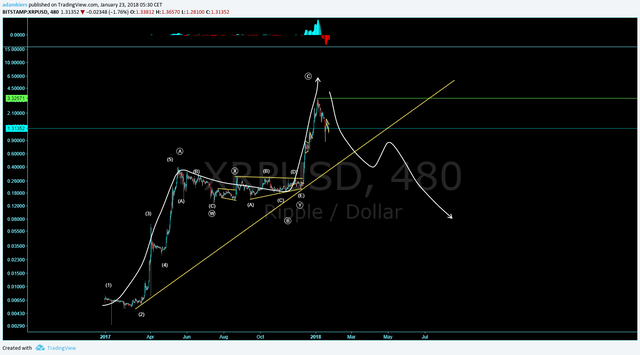
I mentioned in a previous post that both 5 wave and 3 wave motive (trending) structures exist. Could this end up being that way? I honestly don't know, I don't have a crystal ball, but I can show you a 3 wave motive structure on another chart!
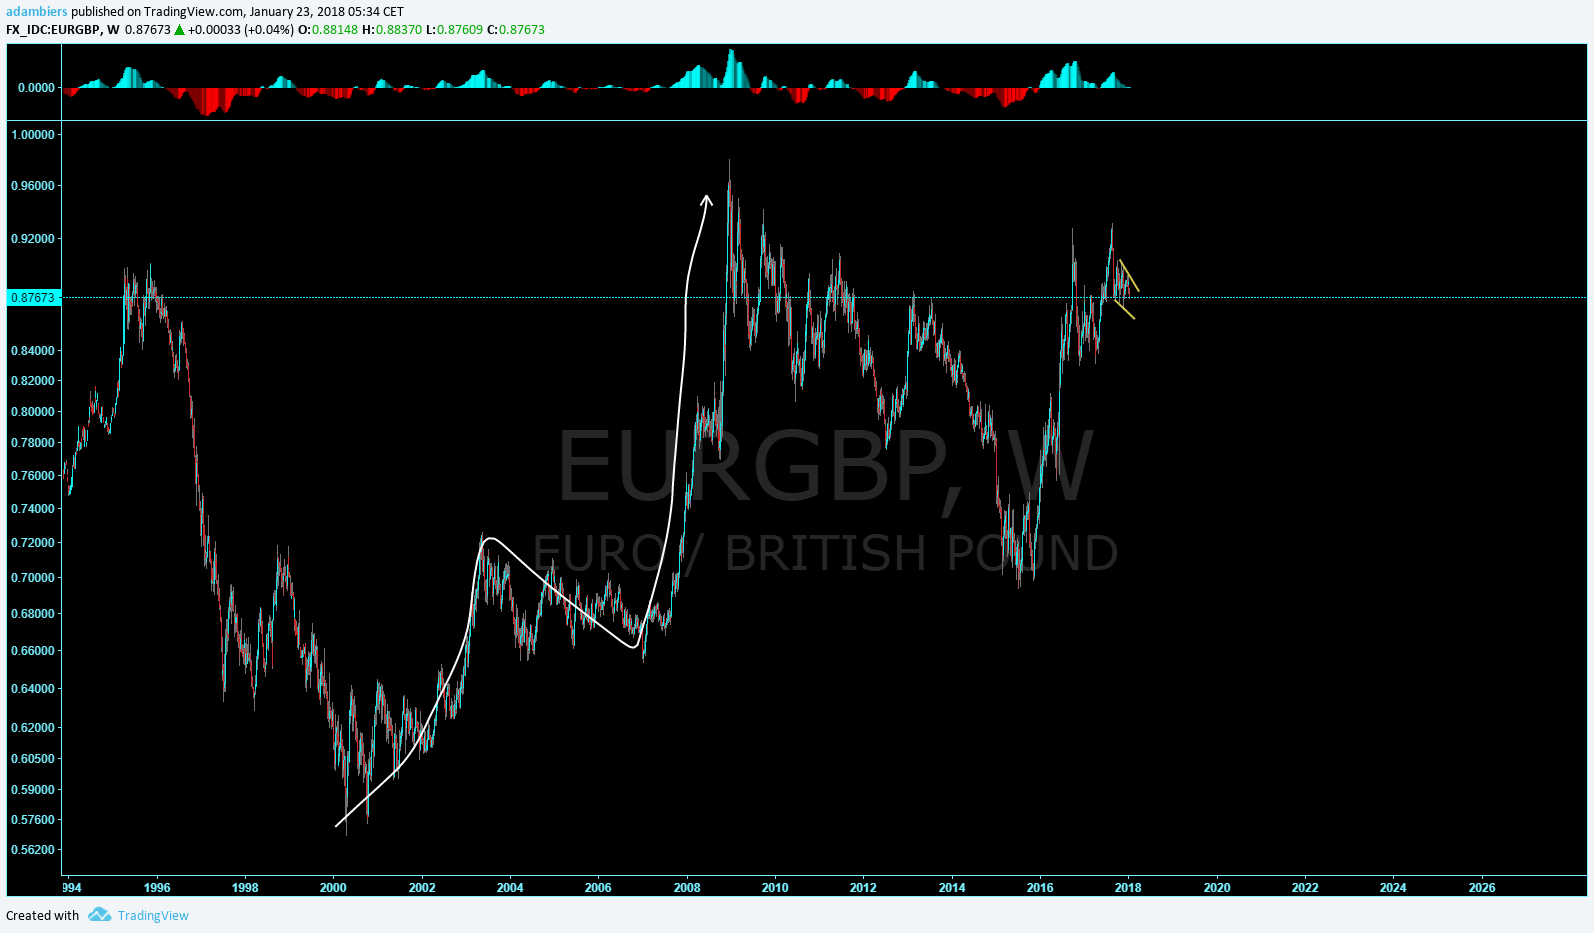
Take a look at the EUR/GBP chart. We have a 4000 pip impulse that had only 3 waves! What kind of non sense is this?! There's no way I see 5 waves in that. I see an impulse a correction and another impulse! This is a good example of why I don't follow the Elliott Wave Principle religiously! I'm very confident we will see more patterns like this! Elliott did see 3 wave impulses in a 5 wave structure which we refer to as a diagonal!
So maybe its not too crazy to think a 3 wave pattern can be a motive impulse... hmmmm
Could dow theory have some value with the whole 3 wave up 3 wave down methodology?
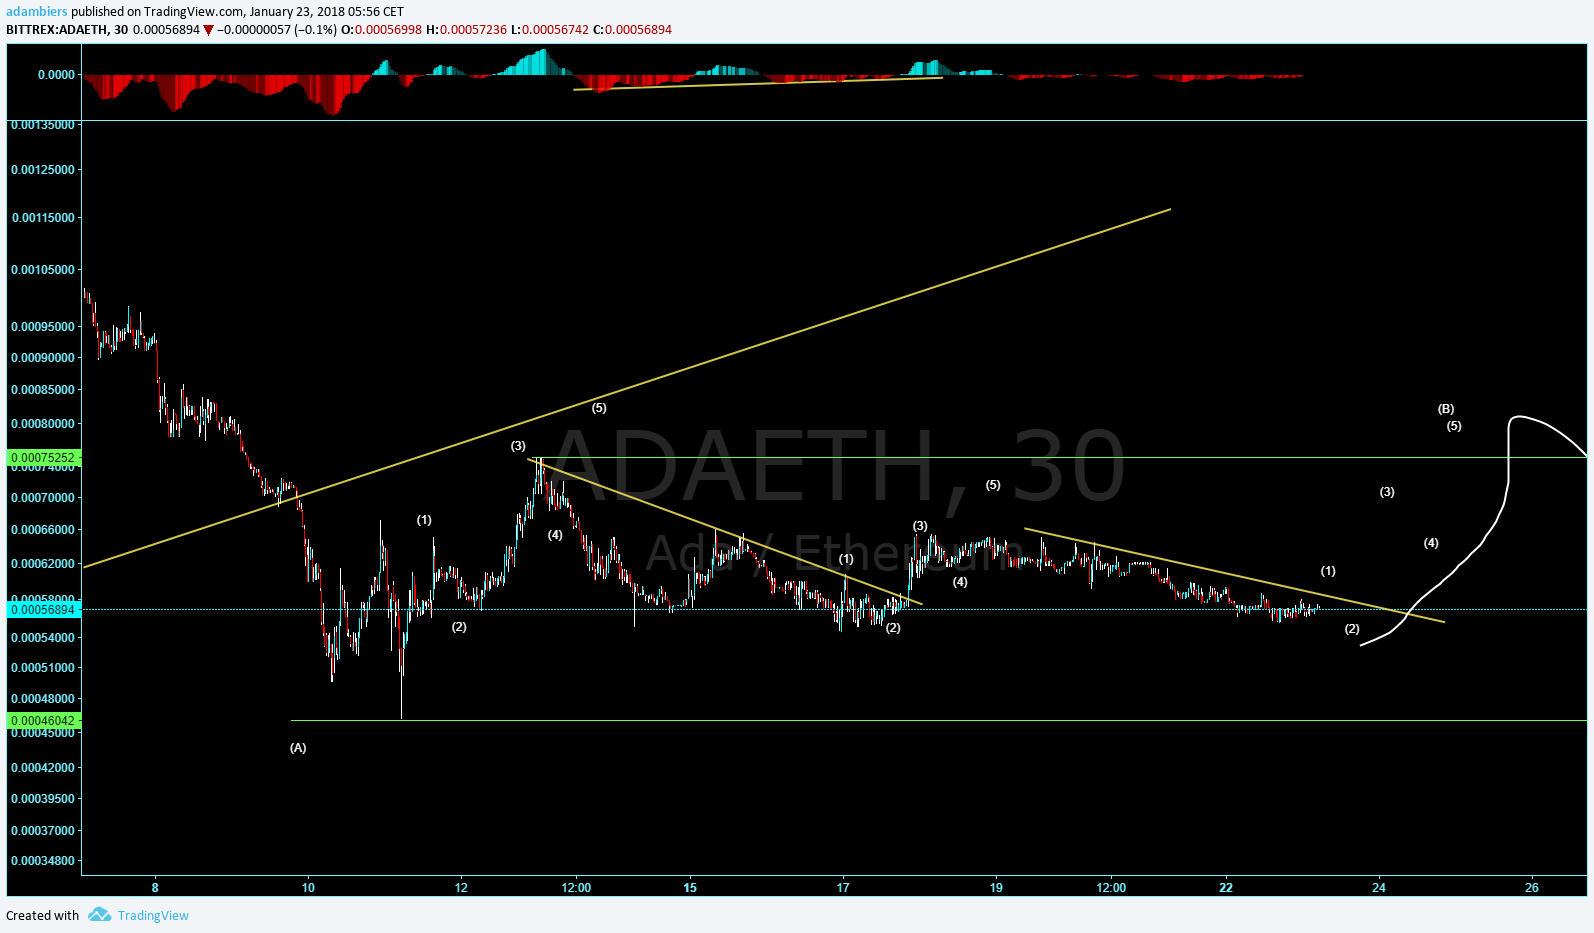
Now take a look at another 5 wave structure on #Cardano chart!

#ADA had a nice 5 wave impulse that peaked around .0014 eth! Now we're starting the correction phase. The correction phase is the most important to understand. When a market is trending the 1-5 wave count will work like a charm. When we're correcting the 1-5 ABC counts will only make you have a bad time! Why? Lets see!
You can see that when you're in a correction trying to count 5 waves is no easy task. This for me is what I had the biggest problem with when I first started learning about the waves! I'd see people posting all the time 1-5 counts everywhere. When I tried it almost never fit how it was supposed to, or I started fixing the charts to somehow make it work.....
It actually didn't work! If you're finding yourself having the same problem, try and zoom out and instead of counting waves, try and figure out the patterns price is making. The whole concept isn't making 5 wave counts, but identifying the patterns price is making. As long as you can find a correction and a trend, it should all fall into place!
Now how do you identify trends and corrections? We're about to get to that playa!
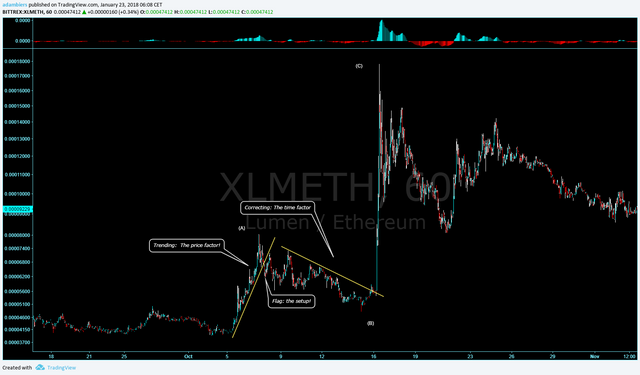
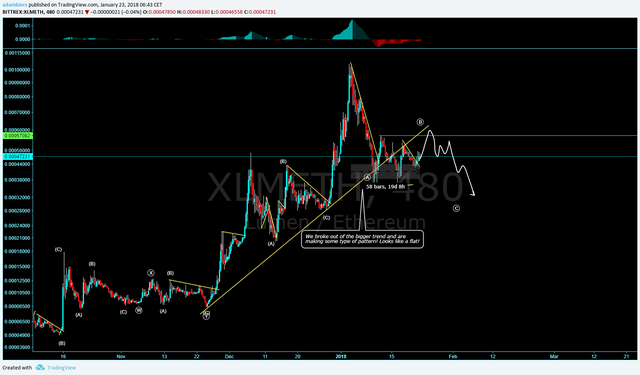
#Stellar #XLM will be our next wave to ride!
Trend lines are perfect for trends! It's in the name! Trends will typically follow some short of rhythm of the trend line, until they swerve and decide to break out the trend! Hey, that sounds like a way to identify if you're trending or correcting? Why yes, yes it is. A lot of times when price breaks through the trend it will start a correction. Does that mean I take the trade right then and there? Hell nah, you need some type of confirmation. That to me would be a flag or whatever you'd like to call those smaller corrections!
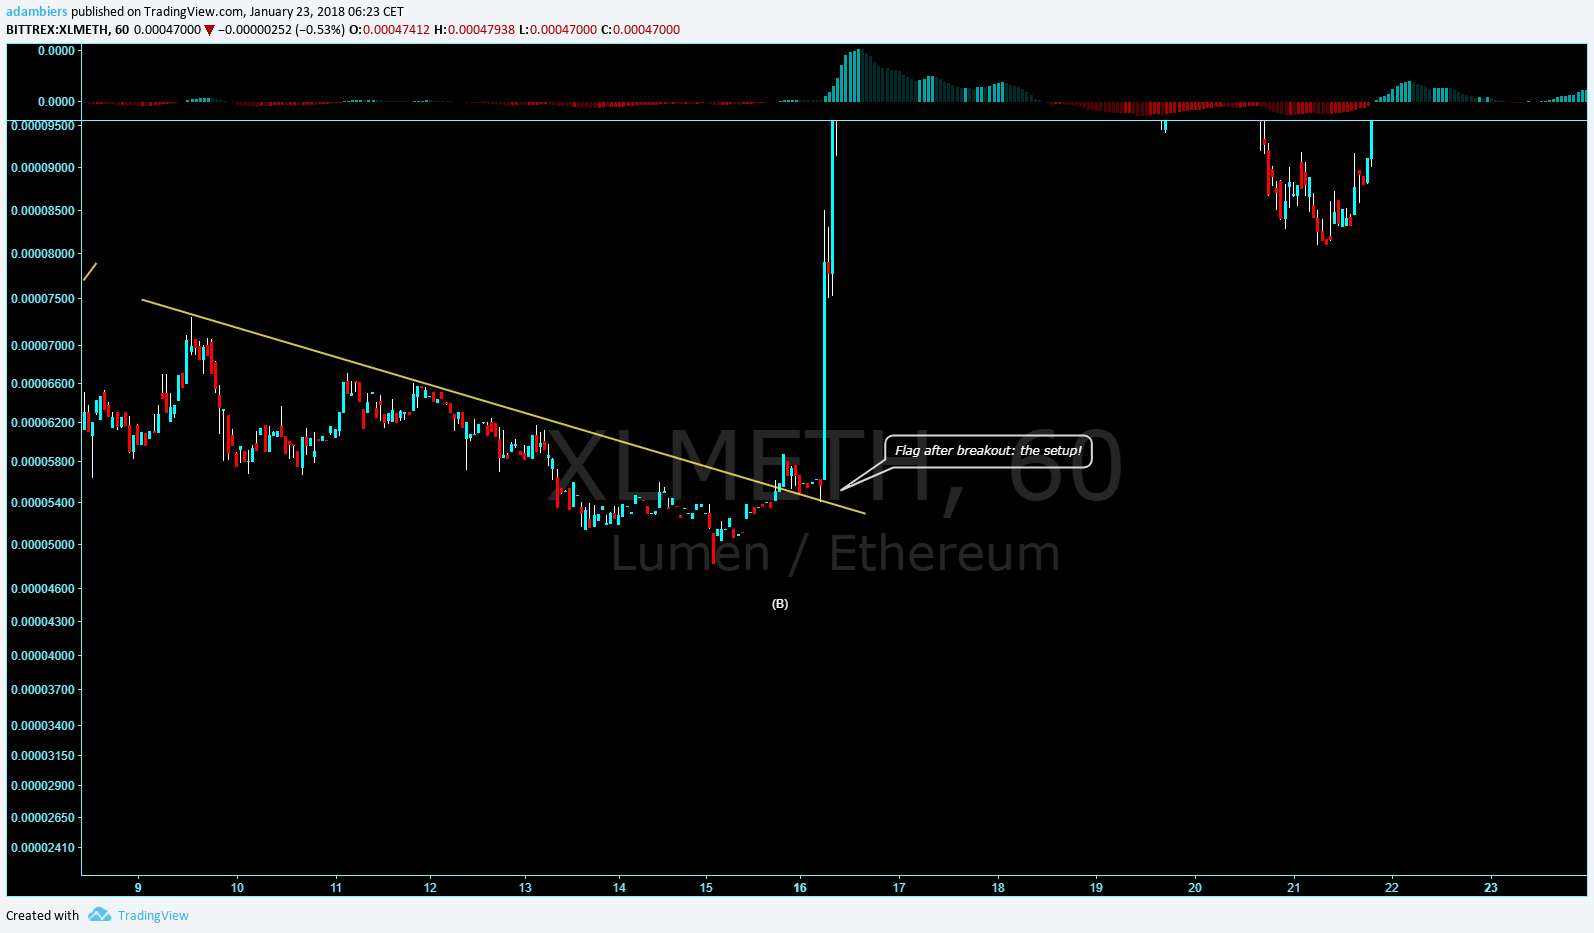
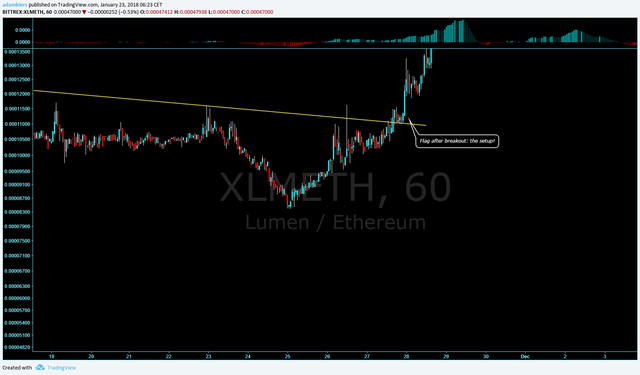
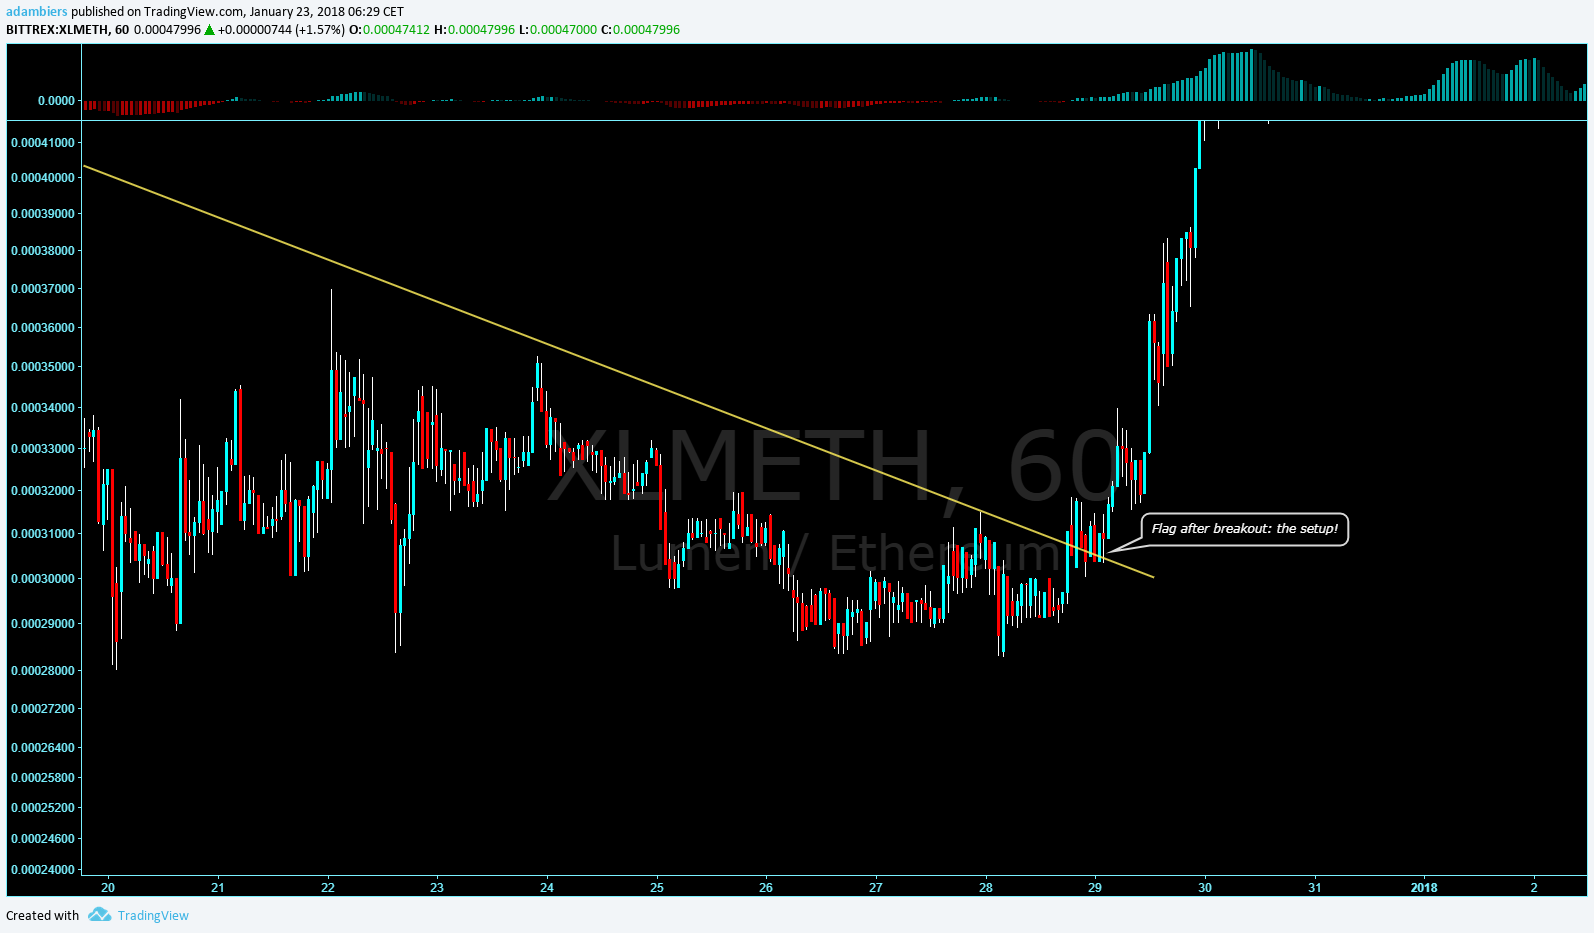
tons of times a flag will happen after a structural breakout. This is my confirmation of the trade. You can start to notice setups happen a little bit before the confirmation. These I'm find with as well, they require better discipline as they're more risky! Now is a good time for another clue on whether we're trending or correcting!
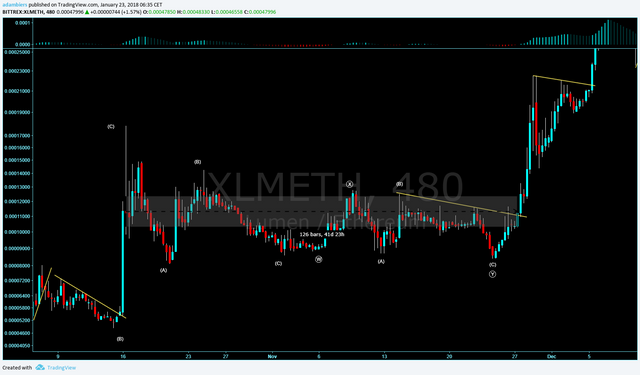
This correction lasted 41 days before the next impulse started!
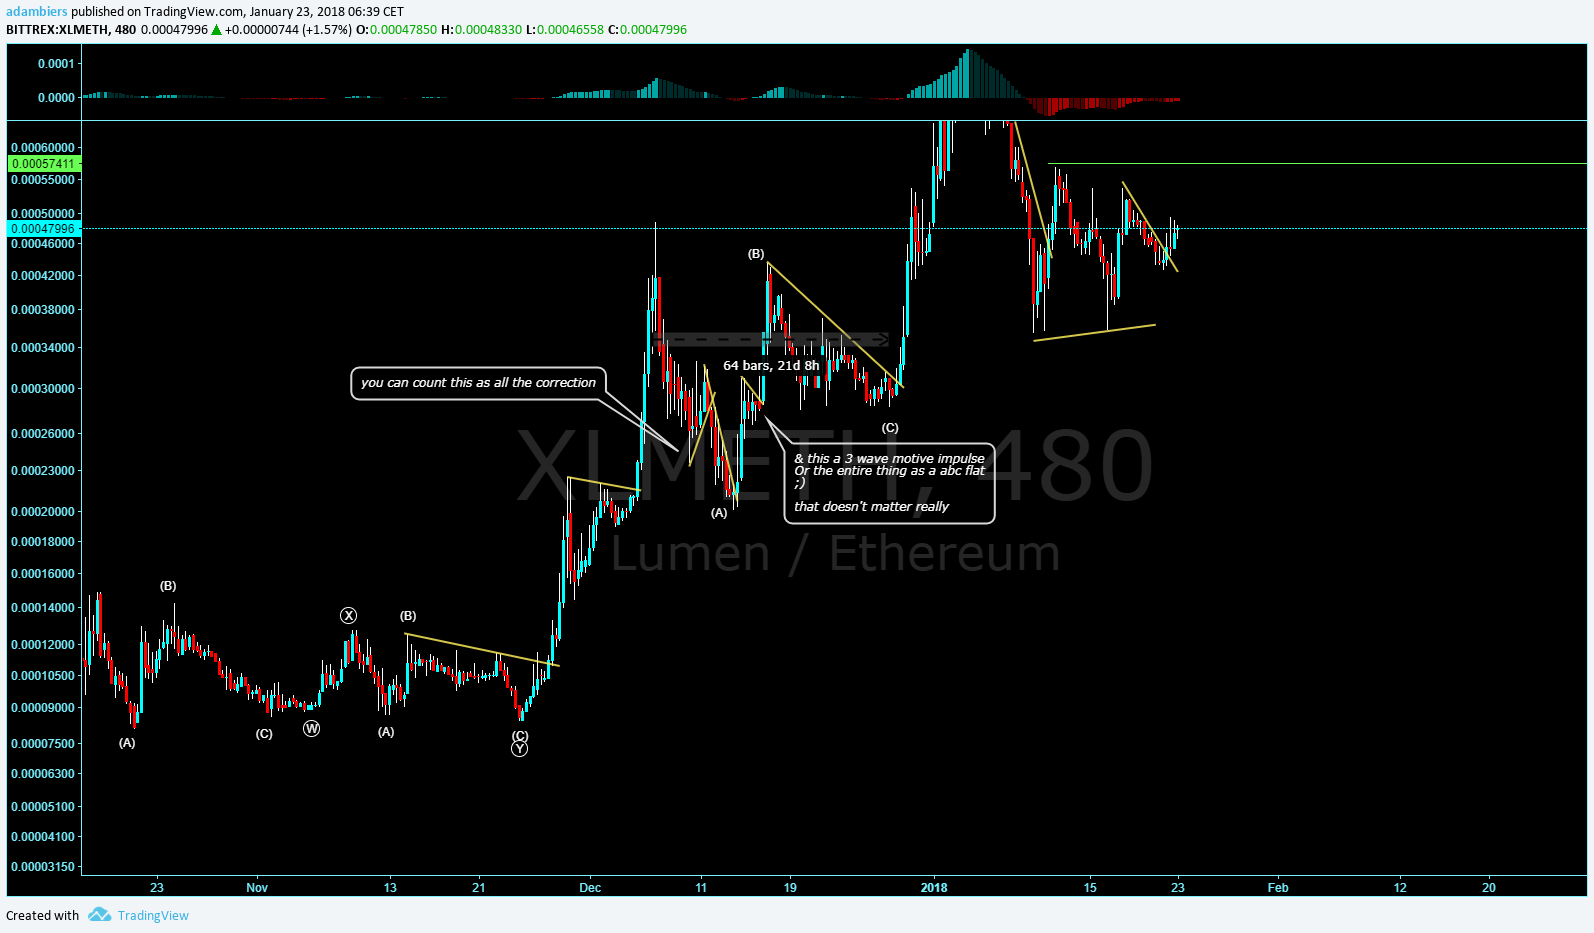
This correction lasted 21 days and wasn't complex!
Can you see that the correction is time consuming? It's like going to the #DMV! note that the impulse is price consuming! It's eating up all the resistance in the path. The impulses are when price moves away from the zone, when the orders are thin after everyone's tired of buying and selling. These are the trades that I want to be a part of... not the trades that stay sideways for a month!
This is what made me stop believing in #SupportandResistance in the conventional way! When the impulse starts it wont respect horizontal lines. They're meant to be broken!
Now currently we have a larger trend break and making a pattern. This could be a sign that will tell me we're going lower. After breaking out of the larger trend and consolidating, there's a good chance that this is making the larger degree correction. If my count is correct I'm expecting this to carry on sideways and down for a bit longer. Over the next few weeks I will know if I suck and got it wrong, Or I'm right and glad I didn't buy now! After breaking the A wave low, I will look for a setup. This is where I'm going to enter another position on XLM!
Thanks for taking the time to read this post! I hope this provided some more value when it comes to wave analysis.
Keep in mind that this is not investment advice, this is just a practical way I use wave analysis to analyze the market!
As always,
Trade responsibly!
-Adam Biers
P.S.
call me crazy but this looks like a bunch of 3 wave structures building up a 5 wave structure!
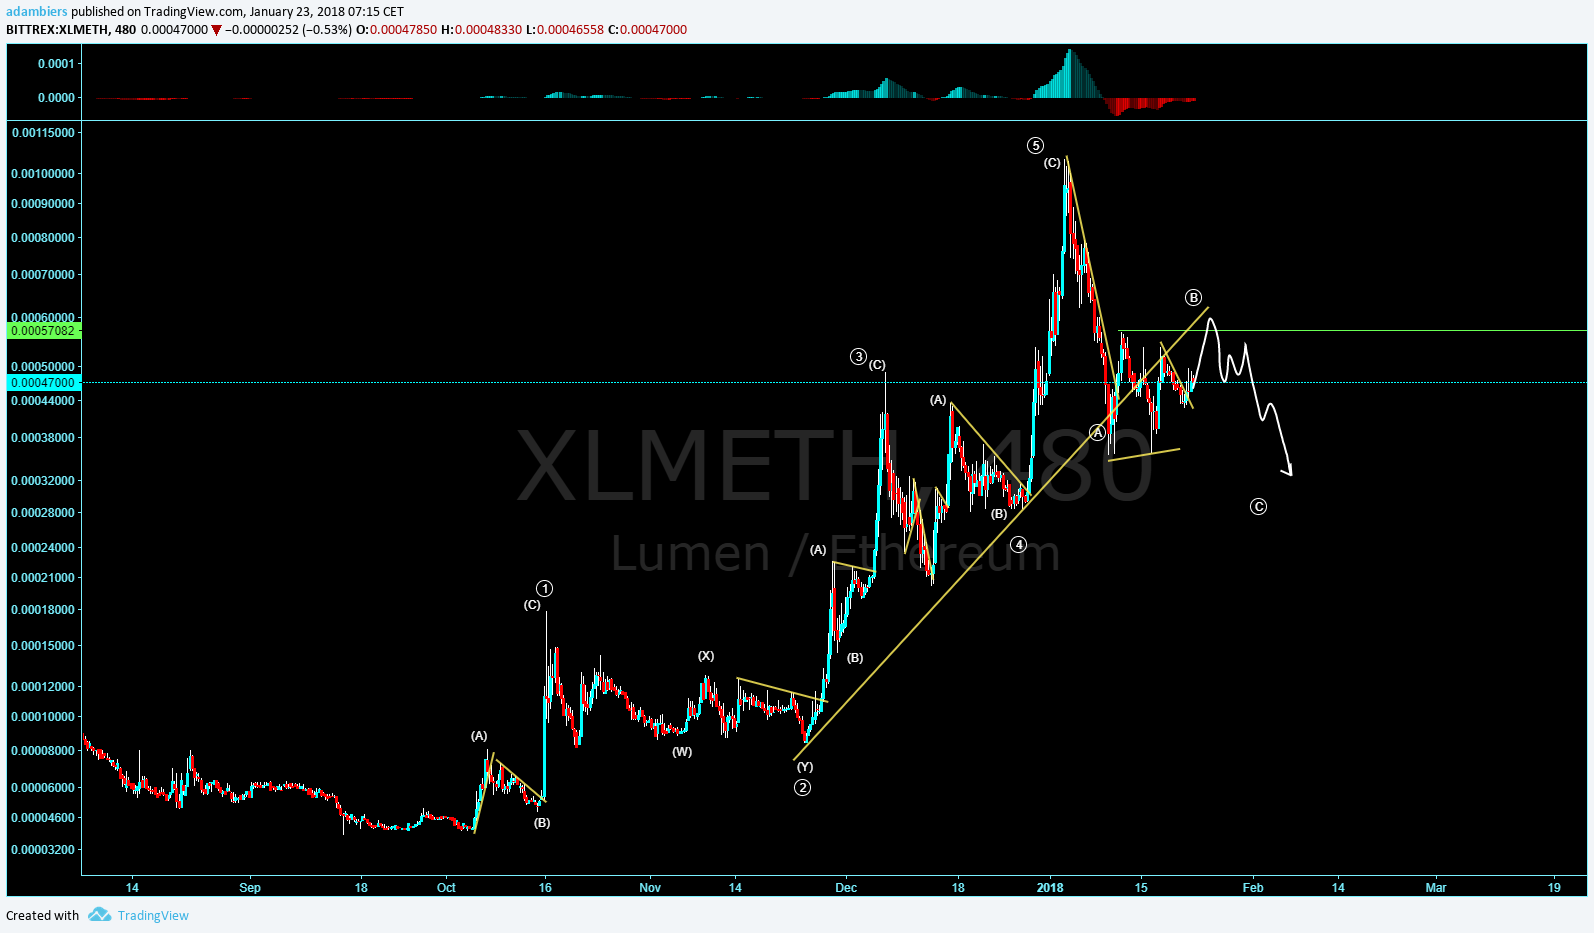
maybe it's a leading diagonal!