ETHusd Analysis 2018-01-19
ETHusd analysis for January 19th, 2018.

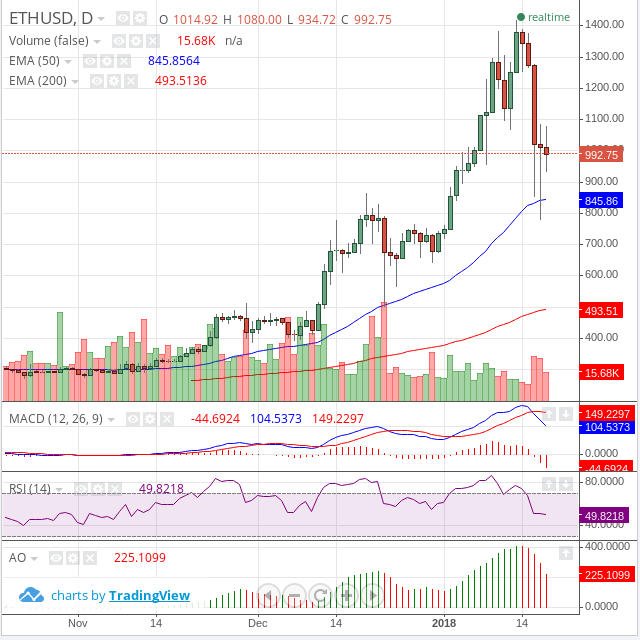
ETHusd Daily Chart

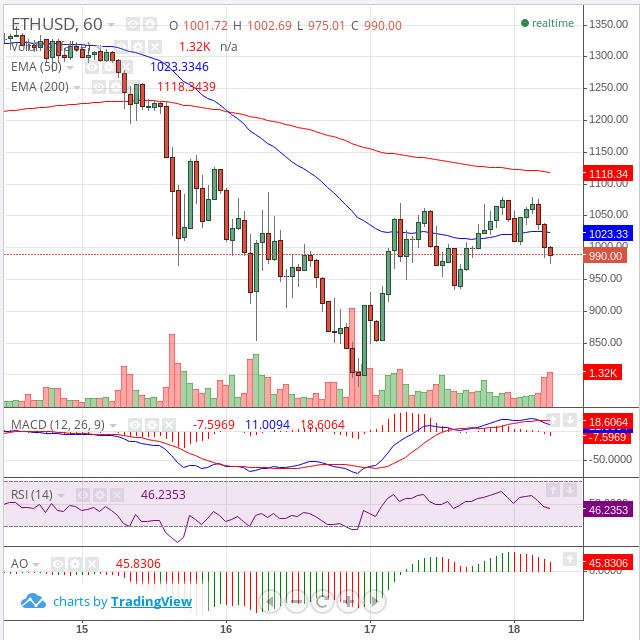
ETHusd Hourly Chart
Similar to the bitcoin chart, the daily has a hammer candlestick pattern. However, the other indicators on Ethereum is more bullish compared to BTC. Those waiting for confirmation could enter position above the 200 EMA on hourly chart.
If this blog post has entertained or helped you to profit, please follow, upvote, resteem and/or consider buying me beers :
| Wallets | Wallet Address |
|---|---|
| BTC | 1HqYTjRdZvss32vDrp1T8gRAXTgdqfZ6VS |
| ETH | 0x1fc22bC528ceE3DaA39555269b70e287dda9aE3E |
| XMR | 46QngrRwYgAbQJzW2ZJZ8HEuirkUW2bw84ajWhk73DLG8iT9NqgfzSU4ddRZbeAaLgFeL6gAxzVtGZPHJhFmCDXF3ZEwimT |

Coins mentioned in post: