Bitcoin Update 19.6.18, Breakout or Fakeout
hey guys welcome to an another session of CoinGuru Analysis. so currently we have some green days passing, bitcoin is looking stronger and everyone is curious & getting excited for the next movements. but as I always say there's always a But.
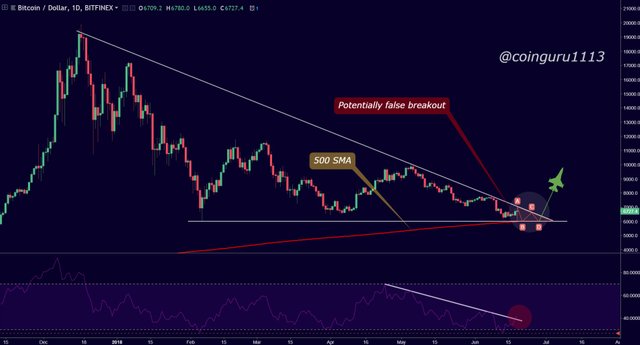
As you can see in this chart above, currently we're in this triangle formation, all we need is to break this formation and close above that upper trend line.
Although RSI is showing a little bounce in momentum, but we do need huge amount of volume to break this formation for the next rally.
in my previous analysis (https://t.me/coinguru1113/5596) i've told you that after breaking that triangle formation we could fall below $6000 which is near 500 SMA. but just opposite to that we see breakout and Bitcoin jumped over $400.
one of the most important thing we must understand that in the present time lots of big whales or institutional money controls or manipulate the markets through bots .
this bots are much more smarter, faster and intelligent than a normal trader. they knew the theories on which market strategies has explained in books or by other great analysts or traders. So they create a false breakout or breakdown based on this theories.
if the theory is indicating for bullish movements they breakdown the market or if the theory is indicating for bearish movements they create false breakouts. they use the sentiments of majority and push the market just in the exact opposite direction. what they get by doing this?
so simple more discounted assets...
we can identify this false breakouts or breakdowns with their momentum and intensity. this are not so powerful as the real breakouts are, and that's they sustain only for a short term.
crypto space is the major game now for this type of false breakouts, coz crypto market is highly volatile and can be operated anytime 24/7 from anywhere in the world.
coming back to our chart so you can see that Bitcoin is still bullish right now and it can make reversal after hitting that upper trend line around 6900.
As i've said previously in this chart https://t.me/coinguru1113/5594 that this dip can take even more time than previous one. probably in next 10-12 days we can hit the bottom and that will be our judgement point. i hope we'll make a real breakout from that level.
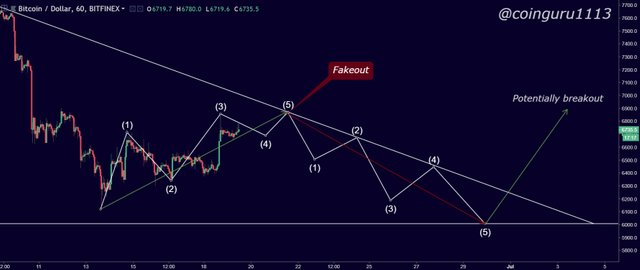
this is a one hour chart, here you can see that probably how Bitcoin will move in next few days.
hope this analysis will help you understand the current situation of Bitcoin.
plz do upvote and comment if you like our work and support us
thankyou
I completely agree with you $6500 support is vary weak we may see further downfall in next couple of days.
We need to break this level with huge volume see the upward journey of bitcoin and with bitcoin other alt coins too :)
Keeps sharing your views with chart here brother appreciate your work. I followed you and i visit every day here on your profile to check the recent chart of the bitcoin.
Cheers...
Thanks for the info. Coinguru rocks
i think bitcoin should retest level of 6000$ in upcoming week if 6400 support break . if bitcoin break 7200 level first target will be 7800 2nd 8600 and third 9900