Thanks for asking, EW! The only way to get a handle on a realistic perspective is via the (1M).
For those who don't know what we're talking about - by (1M), I am referring to using a 1-Month bar chart with which to share my analysis of the current wave in progress.
I meant the timeframes, 4 hours and 1 day, because I wanted to see your internal count of this ABC.
Thanks! I somehow missed your post about it. Your Post is quite exactly what I am thinking.
At this point, I don't care too much if the next bounce is wave X or wave 1 of 3(cycle degree).
I figured that out right after posting my reply
and have edited my initial response in kind.
The bear market bottom could already be in place or soon hereafter.
Regardless of what happens to price from this point forward,
my initial long-term count and analysis, which was rendered nearly a year ago at my initial glance and assessment - would be validated 100% as incredibly accurate and disturbingly prophetic.
hello, first of all many thanks for your current input on the btc.
I saw that you use the bitstamp chart for btc. I am currious ( in case you did not knew about the blx chart) if your vision will change if you use the entire history of btc, meaning the blx (brave new coin) chart:
From my point of view it still has a long way down, hope i am wrong :))
Thanks for asking, EW! The only way to get a handle on a realistic perspective is via the (1M).
Here is what it's looking like to me...
...Quite similar to one of your long-view interpretations if I'm not mistaken.
At this juncture in my life, evaluating time-frames any smaller than this
simply invite a level of noise and confusion that I'd much rather avoid.
I meant the timeframes, 4 hours and 1 day, because I wanted to see your internal count of this ABC.
Thanks! I somehow missed your post about it. Your Post is quite exactly what I am thinking.
At this point, I don't care too much if the next bounce is wave X or wave 1 of 3(cycle degree).
I figured that out right after posting my reply
and have edited my initial response in kind.
hello, first of all many thanks for your current input on the btc.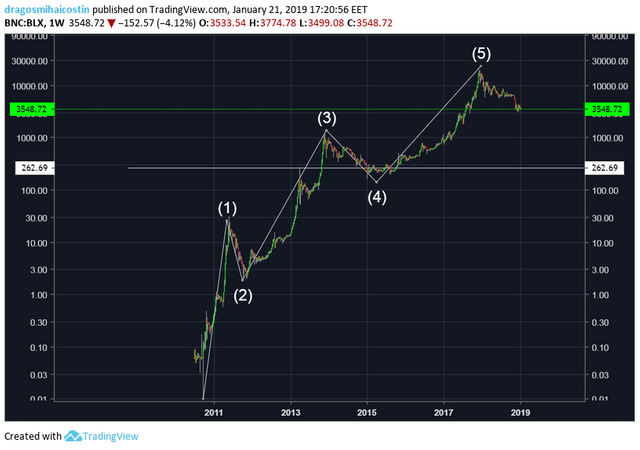
I saw that you use the bitstamp chart for btc. I am currious ( in case you did not knew about the blx chart) if your vision will change if you use the entire history of btc, meaning the blx (brave new coin) chart:
From my point of view it still has a long way down, hope i am wrong :))