3 coins to keep an eye on | Issue #206
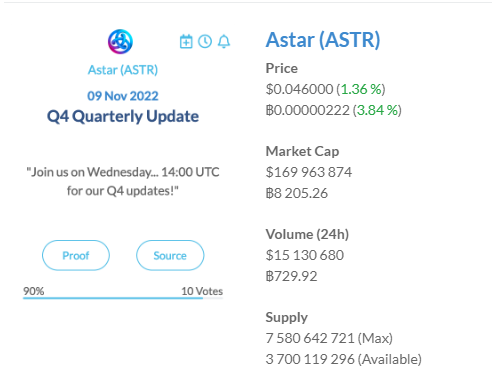
ASTR dropped 40% from its high - but is rallying to retest the drop's origin.
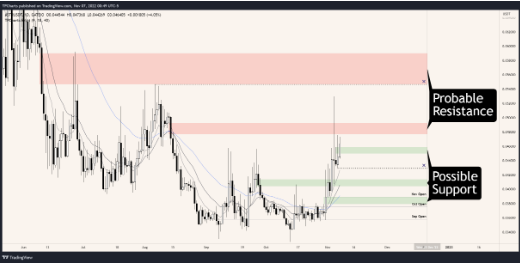
Last week, the price found resistance near a gap beginning at $0.04774 on the daily chart. This gap has confluence with distribution on the weekly chart. It's also where bears rejected bulls on the monthly chart in July. This level could provide resistance or start a consolidation on a retest.
If the price breaks through this level - perhaps from bullish news during Wednesday's quarterly update - $0.05470 could be the next bullish target. This level is a significant swing high on the monthly chart. A filled gap on the daily chart rests just above this high, which could help the high offer resistance.
If the bulls are strong, $0.04590 may offer the closest support. This area showed accumulation last weekend.
A drop below this support might reach possible support and the 18 EMA near $0.04140. A move to this level would sweep bulls' stops under the $0.04295 swing low.
If this level breaks, there is a gap on the daily chart from $0.03895 to $0.03792 that could provide support. This zone, which contains the 40 EMA, is nested between the November and October monthly opens and may require a retest.
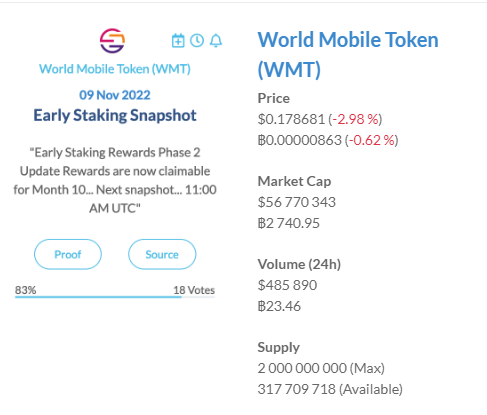
WMT is consolidating near the midpoint of October's 25% drop.
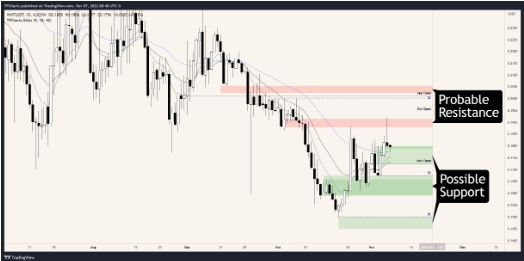
There are no clear signs that the price is ready to break out from its consolidation. However, the daily gap at the current price, near $0.1799, could offer the closest support.
Support may exist down to $0.1722. This level is near the November monthly open and the 9 and 18 EMAs. It's also the most recent area of accumulation on the daily chart. Traders selling after Wednesday's snapshot might help push the price deeper into this support.
A drop to possible support near $0.1676 is also reasonable to expect. Moving to this level would sweep bulls' stops under the swing low at $0.1676. It would also allow bulls to buy more near the consolidation range's low.
Bulls' stops under the significant swing low at $0.1500 may be the target if this support breaks. There is no price action to suggest support under this level. A shallow run could find support between this low and the $0.1450 round level.
The price is currently encountering resistance near $0.1879. This level shows distribution on the weekly and daily charts.
If it breaks, the next target may be a gap on the weekly chart from $0.2024 to $0.2055. Relative equal highs near this level, just above the September monthly open, gives bulls an attractive target.
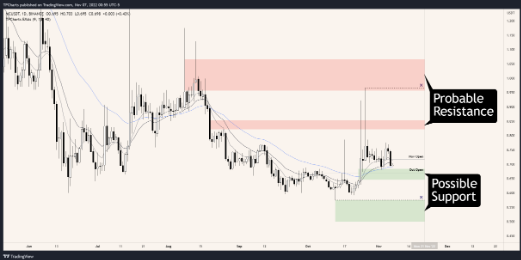
MC spiked upward by 68% since mid-October. It's unclear whether the price reached its upside objective or whether the current consolidation is a pause before another leg upward.
It's reasonable to expect a stop run under the $0.684 swing low before any potential move upward. The daily chart shows a gap below this level, which the price might revisit before a more significant bullish move. Traders selling the news could help push the price into this support, which is just below the 9, 18, and 40 EMAs.
Bulls' stops under the $0.575 swing low may be the next bearish target if this support breaks. There is no price action to suggest support under this level. Round numbers suggest this swing low to $0.500 could be an area to watch for a bullish reversal after any stop run.
A daily and weekly gap begins near $0.822. Late October's upward spike filled this gap, but the price might revisit it and find resistance.
If this filled gap breaks, the next bullish target could be near $1.066. Bears rejected bulls at this level on the weekly chart in August. Late October's swing high at $0.966 offers another draw on price in this region.