Bitcoin PE (price per energy) ratio valuation
Those who invest in bitcoin have to deal with a very difficult asset to valuate. What is it worth? When it starts to drop, where will it stop? Is it all just investing into narrative? With stocks at least you have metrics such as pe, ps, book value etc that are used to at give some idea of the fundamental value, a floor, once a stock start to drop. But the fact that so much energy, resources are used to mine a bitcoin and it's just going to get harder is in a way builds the value in itself for bitcoin even hype is no longer there. Seems like bitcoin can't just one day be considered worthless after all this effort (and the effort is huge). So it seems to me we know at least there's some floor on the price.
I spent a little bit of time and ploted this data manually on monthly time frame. First chart shows the bitcoin PE (price per energy) ratio for the past year. The second chart is price projection based on average PE ratio of 184 and energy usage estimates from link below. I've deleted the two highest PE points on dec 10 2017 and jan 10 2018 that were way outside of cluster . I'm not sure really if there's any meaning in this chart however i'll keep track of this statistic in future to see how close or off it'll be. Source for energy usage and energy usage projection: https://digiconomist.net/bitcoin-energy-consumption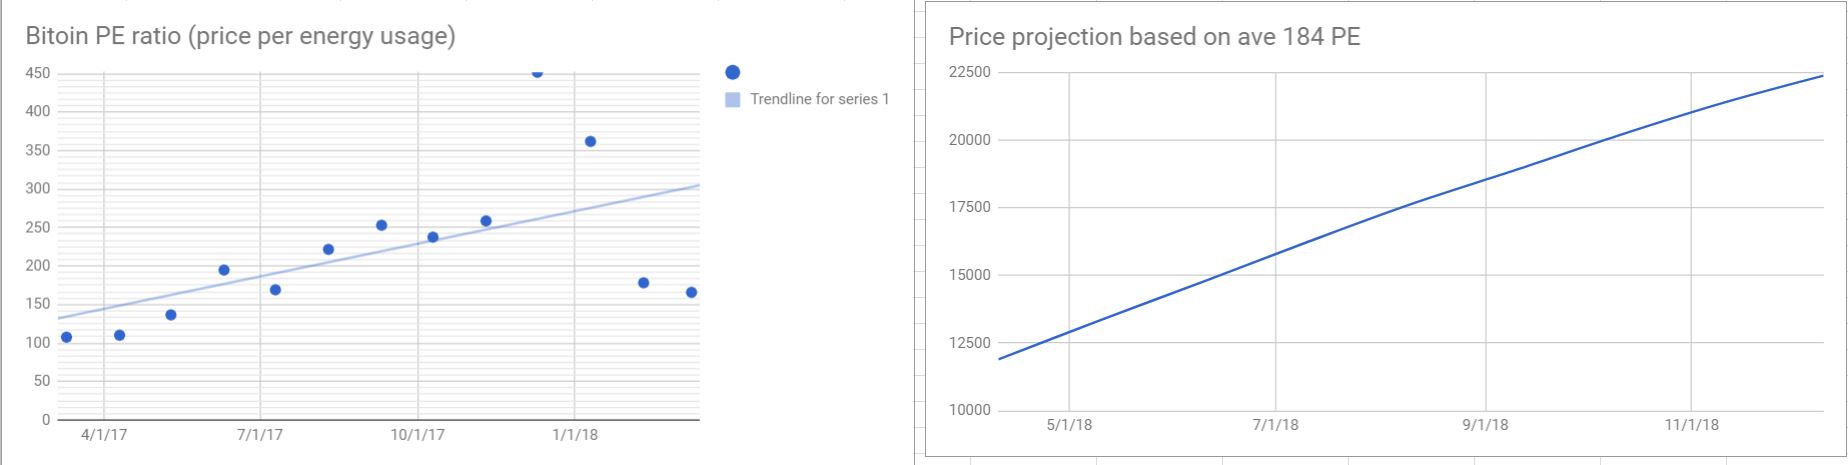
For future viewers: price of bitcoin at the moment of posting is 9115.40USD
Me parece completo, De igual manera es la novedad en inversion. Se recomienda ir de espacio hasta dominar lo mas importabte, Inversion Vs Ganancias
Keep this up, Followed you for more :)