Bitcoin Correction Prediction
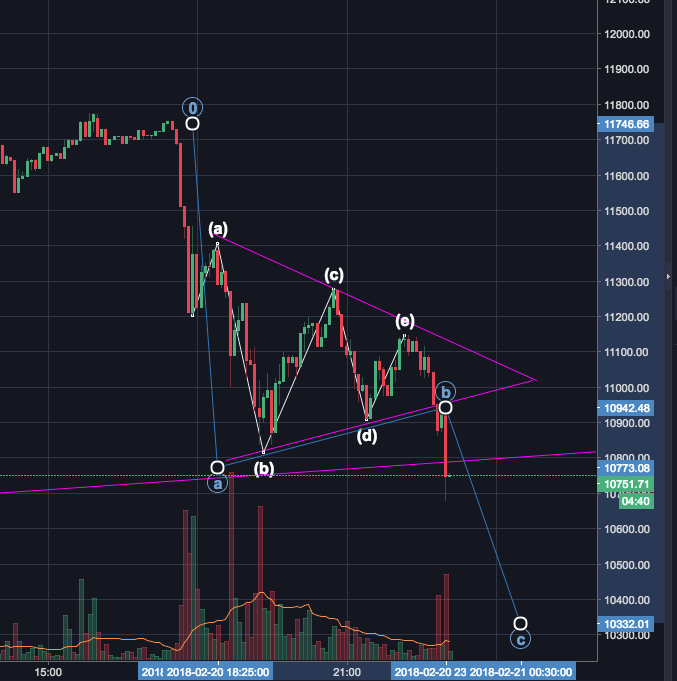
Bitcoin saw a sharp correction around 5:30 pm EST, losing more than $500 in 25 minutes! I started watching the charts and reading my Elliott waves book to help me understand the potential trajectory of this corrective price action.

After the impulsive drop many chart analysts have been anticipating occurred, the price seemed to form a symmetric triangle corrective pattern.
As I was writing this post, the price broke the lower support and now we are witnessing the (potentially) final impulse wave down to price point (A), the completion of the first impulse wave down in the larger wave of one higher degree. The .236 Fibonacci retrace level from the beginning of the most recent bull run is approximately $10,835. The .328 and .618 levels are $9523 and $8130 respectively. We will be able to form a more precise price target for termination of the correction.
Disclaimer: I am not a financial advisor, this is not professional advice, just my opinion based on my research.