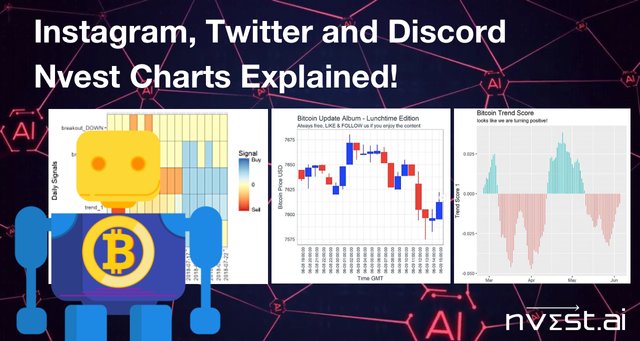
Instagram, Twitter and Discord Nvest Charts Explained!
Would you like to read this post, which explains what the different charts that Nvest posts on Instagram, Twitter and Discord are, because you will then be able to understand them easily and this will help you in your daily crypto trading decisions?
Twitter, Instagram and Discord Nvest Charts Explained!
On July 2, 2018, Avi (Nvest.ai co-founder & Chartered Financial Analyst) made a YouTube video explaining the different charts that are posted daily on Instagram, Twitter and Discord.
Maybe you already have seen them and don't know exactly how they can help you in your crypto trading activities, but this post will explain it all, and we bet that after reading it, you will want to see our daily updates.
We invite you to watch the video below or read the edited transcript with screenshots after the video.
These are the different places you can see our daily updates:
- Twitter: https://twitter.com/nvest_dot_ai
- Instagram: https://www.instagram.com/nvestai/
- Discord: https://discord.gg/SDe8YrU
Nvest Charts Explained!
Hi, everyone.
It’s Avi here from Nvest.
I just want to give you a little update on the market and also try to explain some of these charts that we're putting out on Twitter, Instagram, and Discord and really what they are.
Bitcoin update lunchtime edition
The first chart here is the "Bitcoin Lunchtime Edition" album that we put out every day at lunch time. This just shows you the price of Bitcoin and candles.
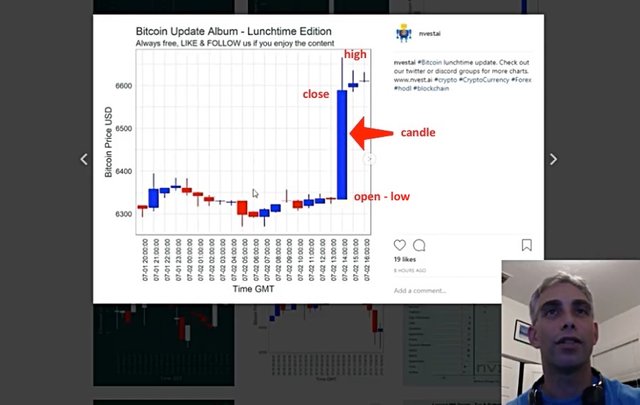
Candles are just a different way of showing prices.
This one shows a price for each hour and it shows the open, high, low, and close. The body of this blue candle shows you where it opened, where it closed, and where was the high.
Then, the low will also be here if there is a wick at the downside. This one there is a little wick on the downside. You get to see the open, high, low, and close of it.
Candlesticks, you can look up on the Internet, they're fairly commonly used for financial markets when you want to chart prices just to be able to see where the prices went through in the whole-time interval.
We are not going to spend too much time on this one.
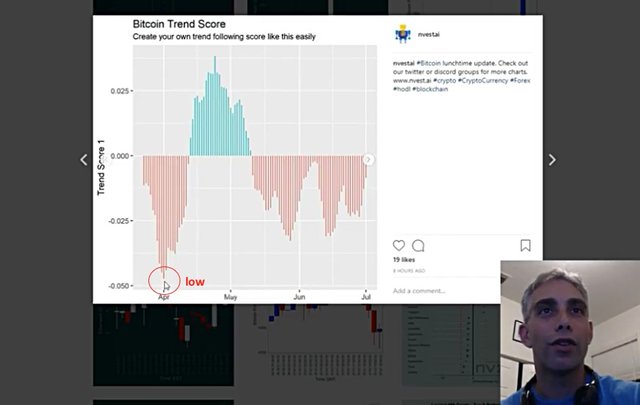
Bitcoin trend score
Now, this is a chart that a lot of people are asking about, they say, "What is this? Your trend score? What does it mean to be a trend score?"
Let's spend a little bit of time here on what exactly it means to be a trend score.
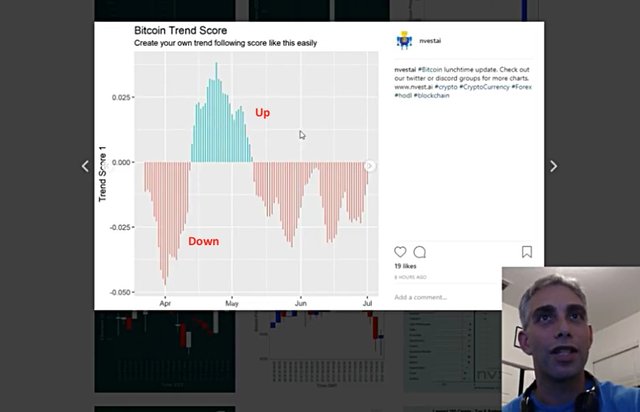
A trend score is anything that you use, a trade or define, and this one I just defined myself was something I use when I look at different stocks, commodities, currencies, and different things and cryptocurrencies obviously, but I found to work very well.
What a trend score really tries to do is just to tell you the direction of the trend. Is it going up or is it going down?
Here you can see, if it's blue, that means the trend is going up.
If it's red, it means it's going down.
That's really what you should take away from it.
As a trend score, if it goes really low, that can also be a contrary signal that it's probably oversold and you’re looking for a bounce back up.
Usually, in general, you want to go with which way the trend score is. The one caveat is that the trend scores are always going to be late, trends scores are never going to get you in at the bottom of a definition.
They're always going to have to wait up until the trend has been formed before you’re going to get an accurate trend score reading.
It does give you an indication, if you know what some of these algorithms models, what they look for, they all look for trends. That's one thing here.
Bitcoin dominance
The next chart is "Bitcoin Dominance."
This is the percentage of the total cryptocurrency market cap that is accounted for by a Bitcoin.
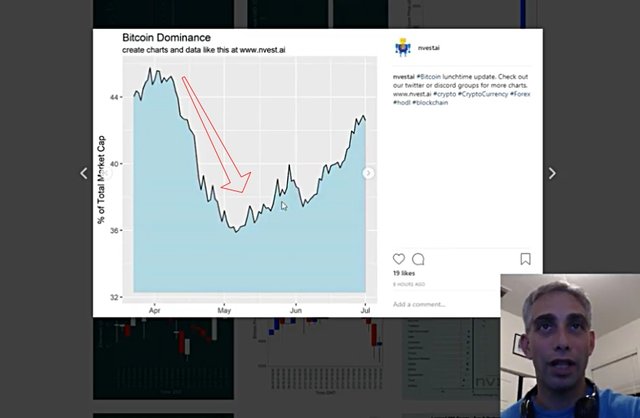
What you're supposed to take away from this is that usually in the past, we've seen that when the Bitcoin dominance is growing, that's usually not such a positive thing for the overall crypto markets. That means the other altcoins are not doing so well, and Bitcoin is doing very well.
Although, if you look over time, Bitcoin dominance has been coming down, but if you're looking at the past couple of months, you have seen that actually Bitcoin dominance has been going up and that's obviously because the cryptocurrency markets have been in a pretty steep bear market.
That's something to keep an eye on. Usually, when Bitcoin starts to underperform and when the dominance starts to go down, that means there’s a pretty good sign for the cryptocurrency markets.
Some people think that Bitcoin dominance over time is going to go down to less than 30%, 20%, or 10%. That's very likely, if we continue to see it growing cryptocurrency ecosystem, but for right now, what the market is telling us is that the dominance is still going up and I would wait for at least a couple of days where it starts to go down before getting anything, reading any too much into these little daily squiggles here.
Daily signals
This last chart is the chart of the Daily Signals page.
A lot of people ask me what is this, what are these different daily signals, this whole big thing? How should I interpret this?
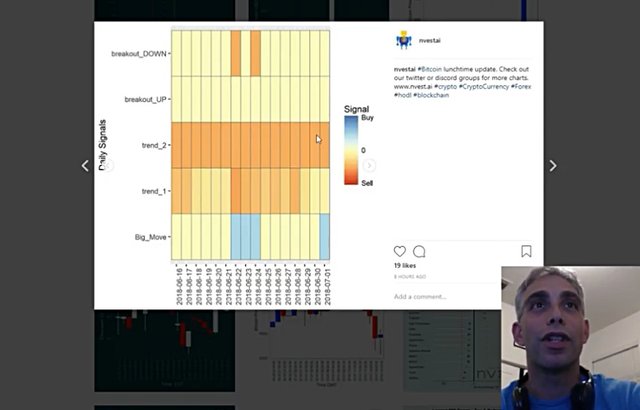
It might take me another video to go through all of this, but I will do my best in this one to give you just a brief understanding of it.
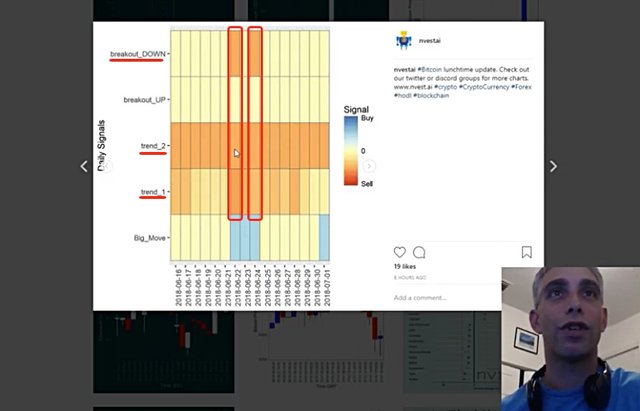
Here we have the "trend score 1," and then we have another "trend score 2."
If it’s red, it’s sell and if it's blue, it's a buy. If it's zero, it’s neither a red or a blue.
The first one, it's going from kind of orangey, nothing to kind of sell to now, it's going back to nothing. It's giving you a turning to positive, the second trend score is still pointing to down, we don't have any breakups.
A breakup or a breakout down is basically if price has gone over a previous high, more classical technical traders will call a breakout. If you have a breakout to the upside, this would light up the blue and if you have a breakup to the downside, it lights up orange or red. We haven't seen a breakout to the downside, but we haven't seen any breakup to the upside either.
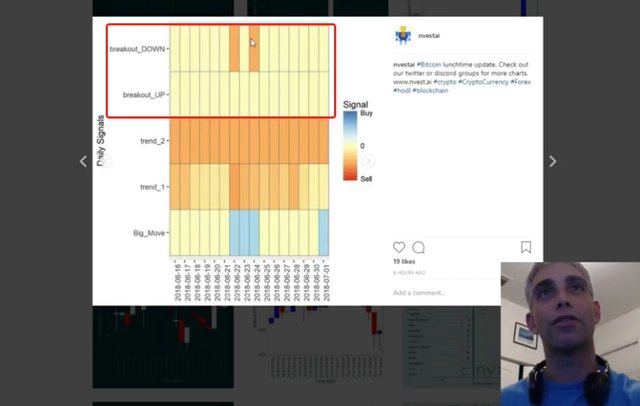
The last one is called "Big Move."
Usually, you want to see the start of a trend or when you're in a good trend, you want to see big moves to confirm that the trend is going.
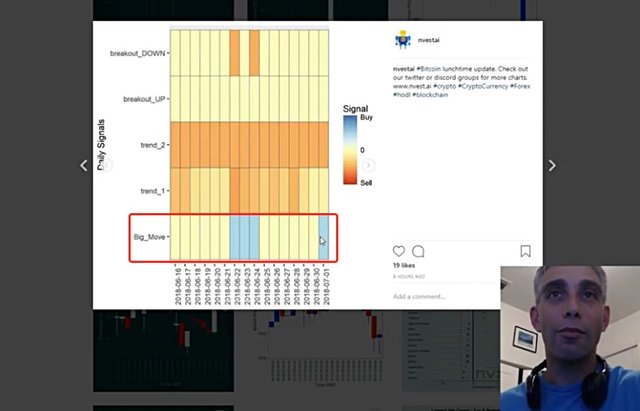
We've seen actually a big move to the upside although here I don't tell you which way the "Big Move" is going up or down, but usually, you want to see a "Big Move" with the start of a trend turning positive.
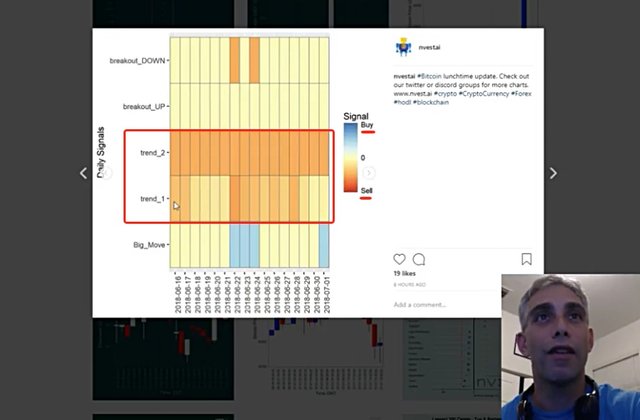
If you were to look at this very quickly every day and you think what can I take away from this?
What I would tell you is that you want to see blue or red, if you want to buy you want to see blue in more than one different column.
Here are the different columns.
If you would want to see the "trend score 2" being blue, you want to see the "trend score 1" being blue and you would want to see the "breakout to the upside" being blue. That will give you like a 3/3 for the upside, and then also the "Big Move" would be good to have in blue.

You don't need to have a "Big Move" every day, what we want to see, every once in a while, is some big moves to the upside.
If you're thinking that it's going to be a downtrend, you want to see "breakouts to the downside," and the two "trend scores" down.
We saw that on June 22nd, and June 24th, we had a "breakout to the downside," and "trend score number 1 & 2" were down, and you know what the price of Bitcoin was doing.
That's all that these little scores are, it’s just another way for you to look at the chart of Bitcoin that we all look at on TraidingView.
Comparing Nvest charts to TradingView
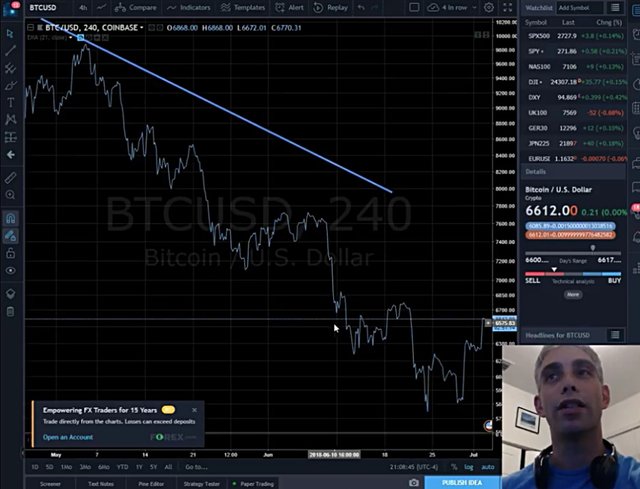
You can look at this and try to see here's a longer-term chart.
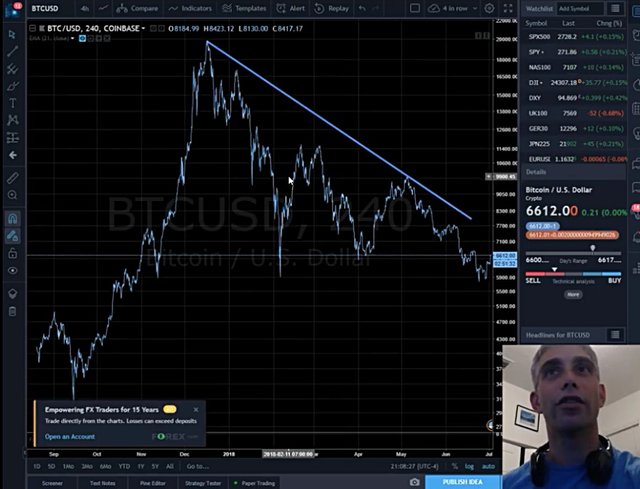
Then, you might want to zoom in and you want to see what is the price doing here and it's going up and it's going down.
Maybe you don't have time to zoom in and zoom out of the chart to look at everything that you want to look at, and look at the transaction volumes and everything else.
The Bitcoin dominance, you have to go to "coin market cap" and click on another chart there. Maybe you don’t have the time to go and click through all of those different charts.
Here, we just give it to you for free as always and in just a nice way to look at.
What I will try to explain to you in a couple of videos later is really that's what the machines, that's what the algorithms, that's how all the machine learning works.
It looks at a bunch of different data and it puts all that data together, and then it assembles a model with that. That's really what we're trying to do, give you a feel for how machines and how algorithmic traders and how just people, in general, should think about the market.
You just don't look at one chart, and then make and draw conclusions about where the market is going. You have to look at a bunch of different things, put the pieces of the puzzle together, and then you see what conclusion you want to draw.
If I look at this chart, just going to Bitcoin today, we can see that we had a nice bottom move off of the support level here.
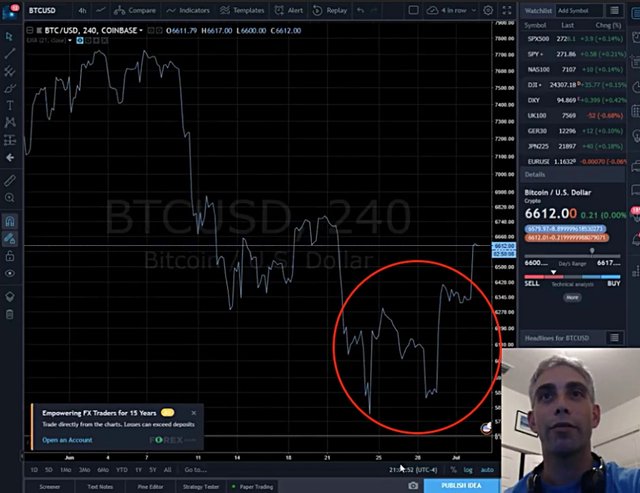
This is the 6,000 support and we had a nice "Big Move," but you have to put the move in context, we're still in a pretty much a downtrend.
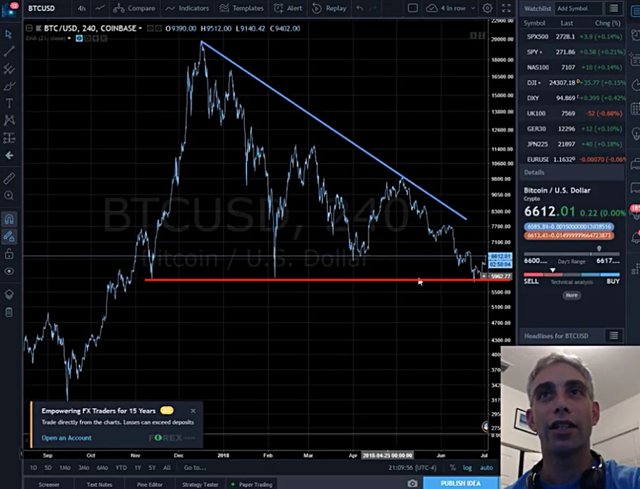
We don't want to get too bullish just yet, but we are starting to get some good signs because we have some downtrends that are going to be broken here, like this trend line is probably going to be broken soon.
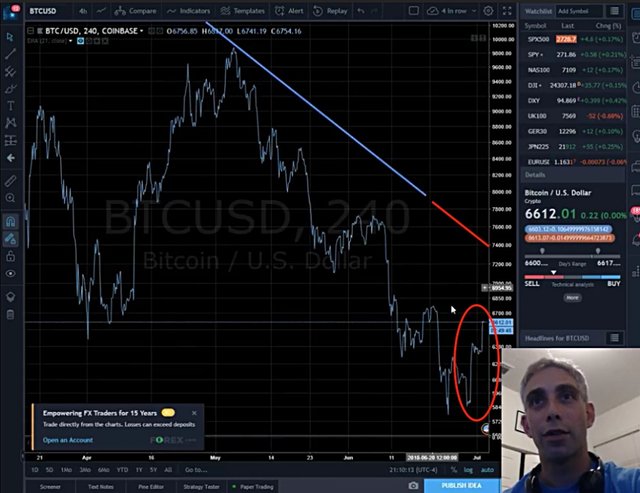
If you're using some moving average systems, it is probably going to turn up as well and we’ve had some big move buying pressure.
These are the sort of things you look at, at the bottom of a trend, but again the whole point, this is to put all of this information together into a mosaic and assemble the pieces of the picture.
What we're trying to do with Nvest is to give you the information, give you all the data, whether it’s the price data, the technical data, you want to look at, ranking data, or sentiment data, or whatever type of data it is, we’re going to give it to you, so you can put it together easily in a nice visually appealing way.
Then you will be able to come up to make the conclusions for what you should do.
With that, I'm going to leave you with its already a little long video here, but hopefully, that explains a little bit about our Instagram account and what are these pictures that we're pushing out every day, and hopefully, you get a better feel for exactly what they are.
Thanks.
Would you upvote this post and follow us because this will encourage us to write more articles like this one?

Crypto data & analytics powered by Machine Learning and Artificial Intelligence.
Nvest.ai is helping crypto traders and investors make better decisions with next generation tools and leading them to the next level.
Visit our website: http://nvest.ai

Your post had been curated by the @buildawhale team and mentioned here:
https://steemit.com/curation/@buildawhale/buildawhale-curation-digest-08-07-18
Keep up the good work and original content, everyone appreciates it!
Thank you very much @nicnas for curating our post.
You got a 3.31% upvote from @postpromoter courtesy of @nvest!
Want to promote your posts too? Check out the Steem Bot Tracker website for more info. If you would like to support the development of @postpromoter and the bot tracker please vote for @yabapmatt for witness!
Congratulations @nvest! You have completed the following achievement on Steemit and have been rewarded with new badge(s) :
Click on the badge to view your Board of Honor.
If you no longer want to receive notifications, reply to this comment with the word
STOPTo support your work, I also upvoted your post!