GameCredits Price Analysis 7/13/2017
We may have hit bottom.
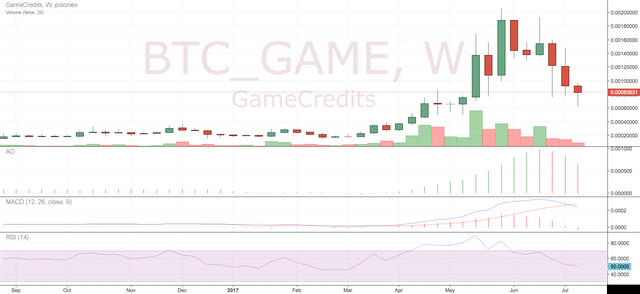
Weekly chart: 
Weekly shows RSI is resting at 50 and could consolidate here for a few weeks, in order for AO/MACD to return to 0
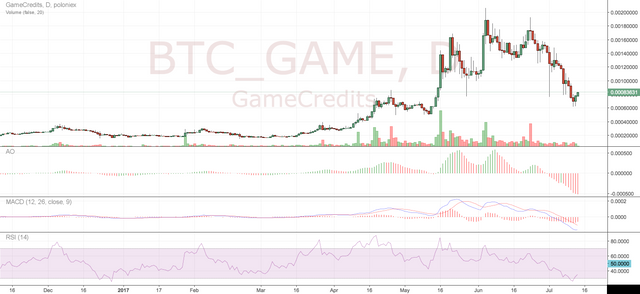
Daily chart: 
Daily shows RSI entered oversold territory and bounced back. For the short term (1-3 days), the low is in.
Assuming that the correction is over, we are headed to ATH's. Watch Bitcoin to see where GAME and other alts go - its very clear on charts that there is a correlation with Bitcoin.