STRAT technical analysis


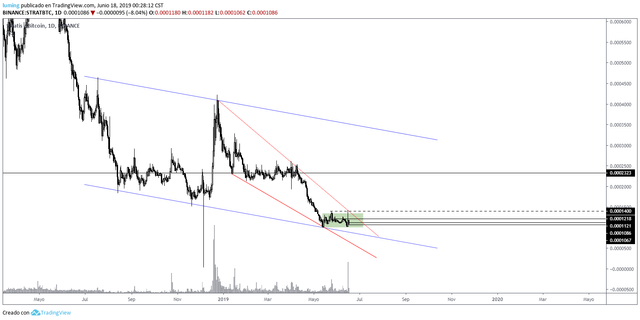
STRAT seen from the temporality of 1D we can observe how the price remains within the range of accumulation indicated in the graph within the green rectangle, we can also observe in the major figure as it has come forming a parallel channel, I have indicated it in blue color to differentiate it from the descending wedge in red color, where we see that the previous candle when touching the resistance to found offer that has pushed the price down.

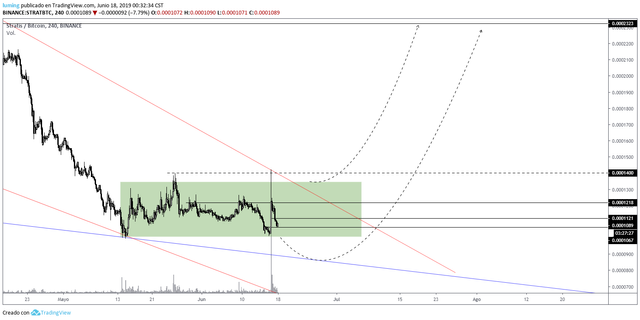
STRAT seen from the temporality of 4H we can observe more closely the zone of accumulation, we see the bearish impulse that has provoked the resistance of the wedge, there are two possible scenarios, which I have pointed out in the graph above, in the first scenario the price breaks above the range and maintains its bullish movement until reaching our first take profit 2323, in the second scenario, the price breaks below the range and performs a pullback finding the necessary demand in the support of the parallel channel in blue to finally break the resistance of the falling wedge and reach our take profit.

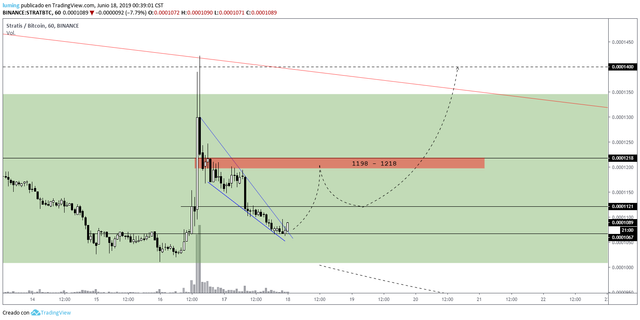
STRAT seen from the temporality of 1H we can observe how the current candle is above the resistance of the descending wedge to end so it is very possible that in the short term reaches the price range of 1198 – 1218 indicated in the chart inside the red rectangle, when reaching that area the price can perform a throwback to the support located in the 1121 to continue our upward movement and try again to break the resistance of the red descending wedge.

In the image above we can see the enormous amount of volume that has entered yesterday June 16, 2019 compared to the previous 4 days, this has to favor an upward movement in the short term.
In conclusion, the price is still in good buying moment, we have accumulation range, price near the support of the parallel channel and very near to break the descending wedge, to this we add the entry of volume of great relevance that we can see in coinmarketcap, then we have greater possibilities of a possible break of the range in favor of an uptrend.
As I always say, you have to be aware of the movement, invalidations can occur, there is no 100% reliable analysis, take your own precautions when trading.
You can follow me on Twitter: https://twitter.com/armijogarcia
Posted from my blog with SteemPress : https://mentormarket.io/cryptocurrencies/mrbullishsail/strat-technical-analysis/