Crypto Contest February 15: DeFi Land
DeFi Land (FTX: DFLUSD) has broken out of the triangle pattern in the four-hour chart.
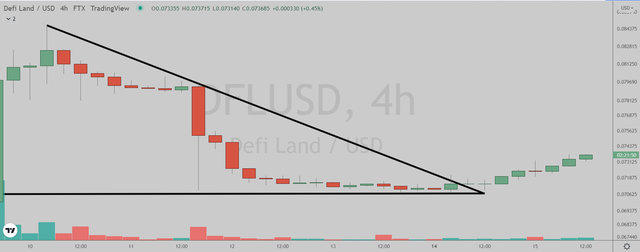
(Chart courtesy of Tradingview.com(log scale))
Elliott Wave Analysis
In Elliott Wave terms, DFL began a red wave one advance on February 6. The red wave one (blue sub-waves i-ii-iii-iv-v) peaked on February 10 and the red wave two (blue sub-waves a-b-c) correction ended on February 13. If this wave count is correct, DFL should be heading next towards the February 10 peak in the red wave three.
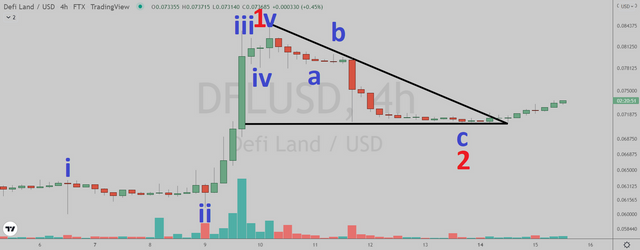
(Chart courtesy of Tradingview.com(log scale))
Funnymentals
DeFi Land is a multi-chain agriculture-simulation game created to gamify decentralized finance. Crypto Anxiety reviewed the game last month.
(Sources: https://defiland.app/)
How Will DeFi Land Trade?
DeFi Land (FTX: DFLUSD) four-hour chart by Tradingview.
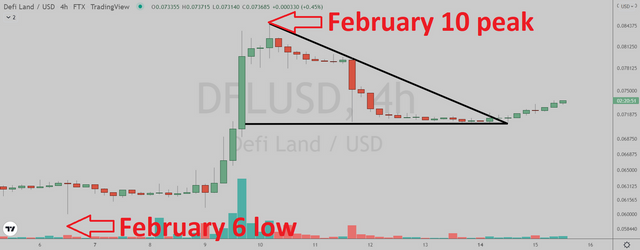
(Chart courtesy of Tradingview.com(log scale))
Prizes
I will be giving upvotes to the correct answers (posts only).
Rules
This poll will expire in one week. Only one vote per person.
Which one will happen first?
Please select one of the three choices and comment below.
DFL will takeout the February 10 peak
DFL will drop below the February 6 low
DFL will stay in a trading range between the February 6 low and the February 10 peak until March 25
DFL will stay in a trading range between the February 6 low and the February 10 peak until March 25
DFL will drop below the February 6 low
Correct.
DFL will stay in a trading range between the February 6 low and the February 10 peak until March 25
DFL will drop below the February 6 low
Correct. Upvoted your post:
https://steemit.com/joke/@frit/joke
DFL will takeout the February 10 peak
DFL will stay in a trading range between the February 6 low and the February 10 peak until March 25
DFL will drop below the February 6 low
Correct. Upvoted your post:
https://steemit.com/cristiano/@voice71/cristiano-ronaldo
DFL will stay in a trading range between the February 6 low and the February 10 peak until March 25
DFL will takeout the February 10 peak
DFL will drop below the February 6 low
Correct. Upvoted your post:
https://steemit.com/hive-183653/@bgteam/weekly-delegation-reward-distribution-week-10-or-sedmichno-razpredelenie-na-nagradite-za-delegirane-sedmica-10