the Relative Strength Index
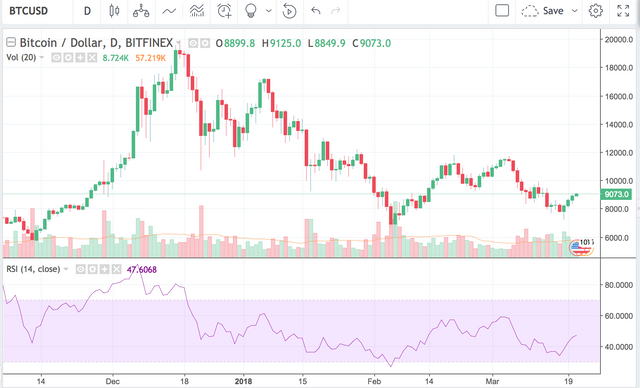
In this post, we're just observing Bitcoin RSI, an indicator, at 47.
20 = Oversold
80=Overbought
Formula:
RSI = 100 – [100 / ( 1 + (Average of Upward Price Change / Average of Downward Price Change ) ) ]
We are right in the middle of a short-term bull market right now as the RSI # is in the middle.
A likely return to $11,000?
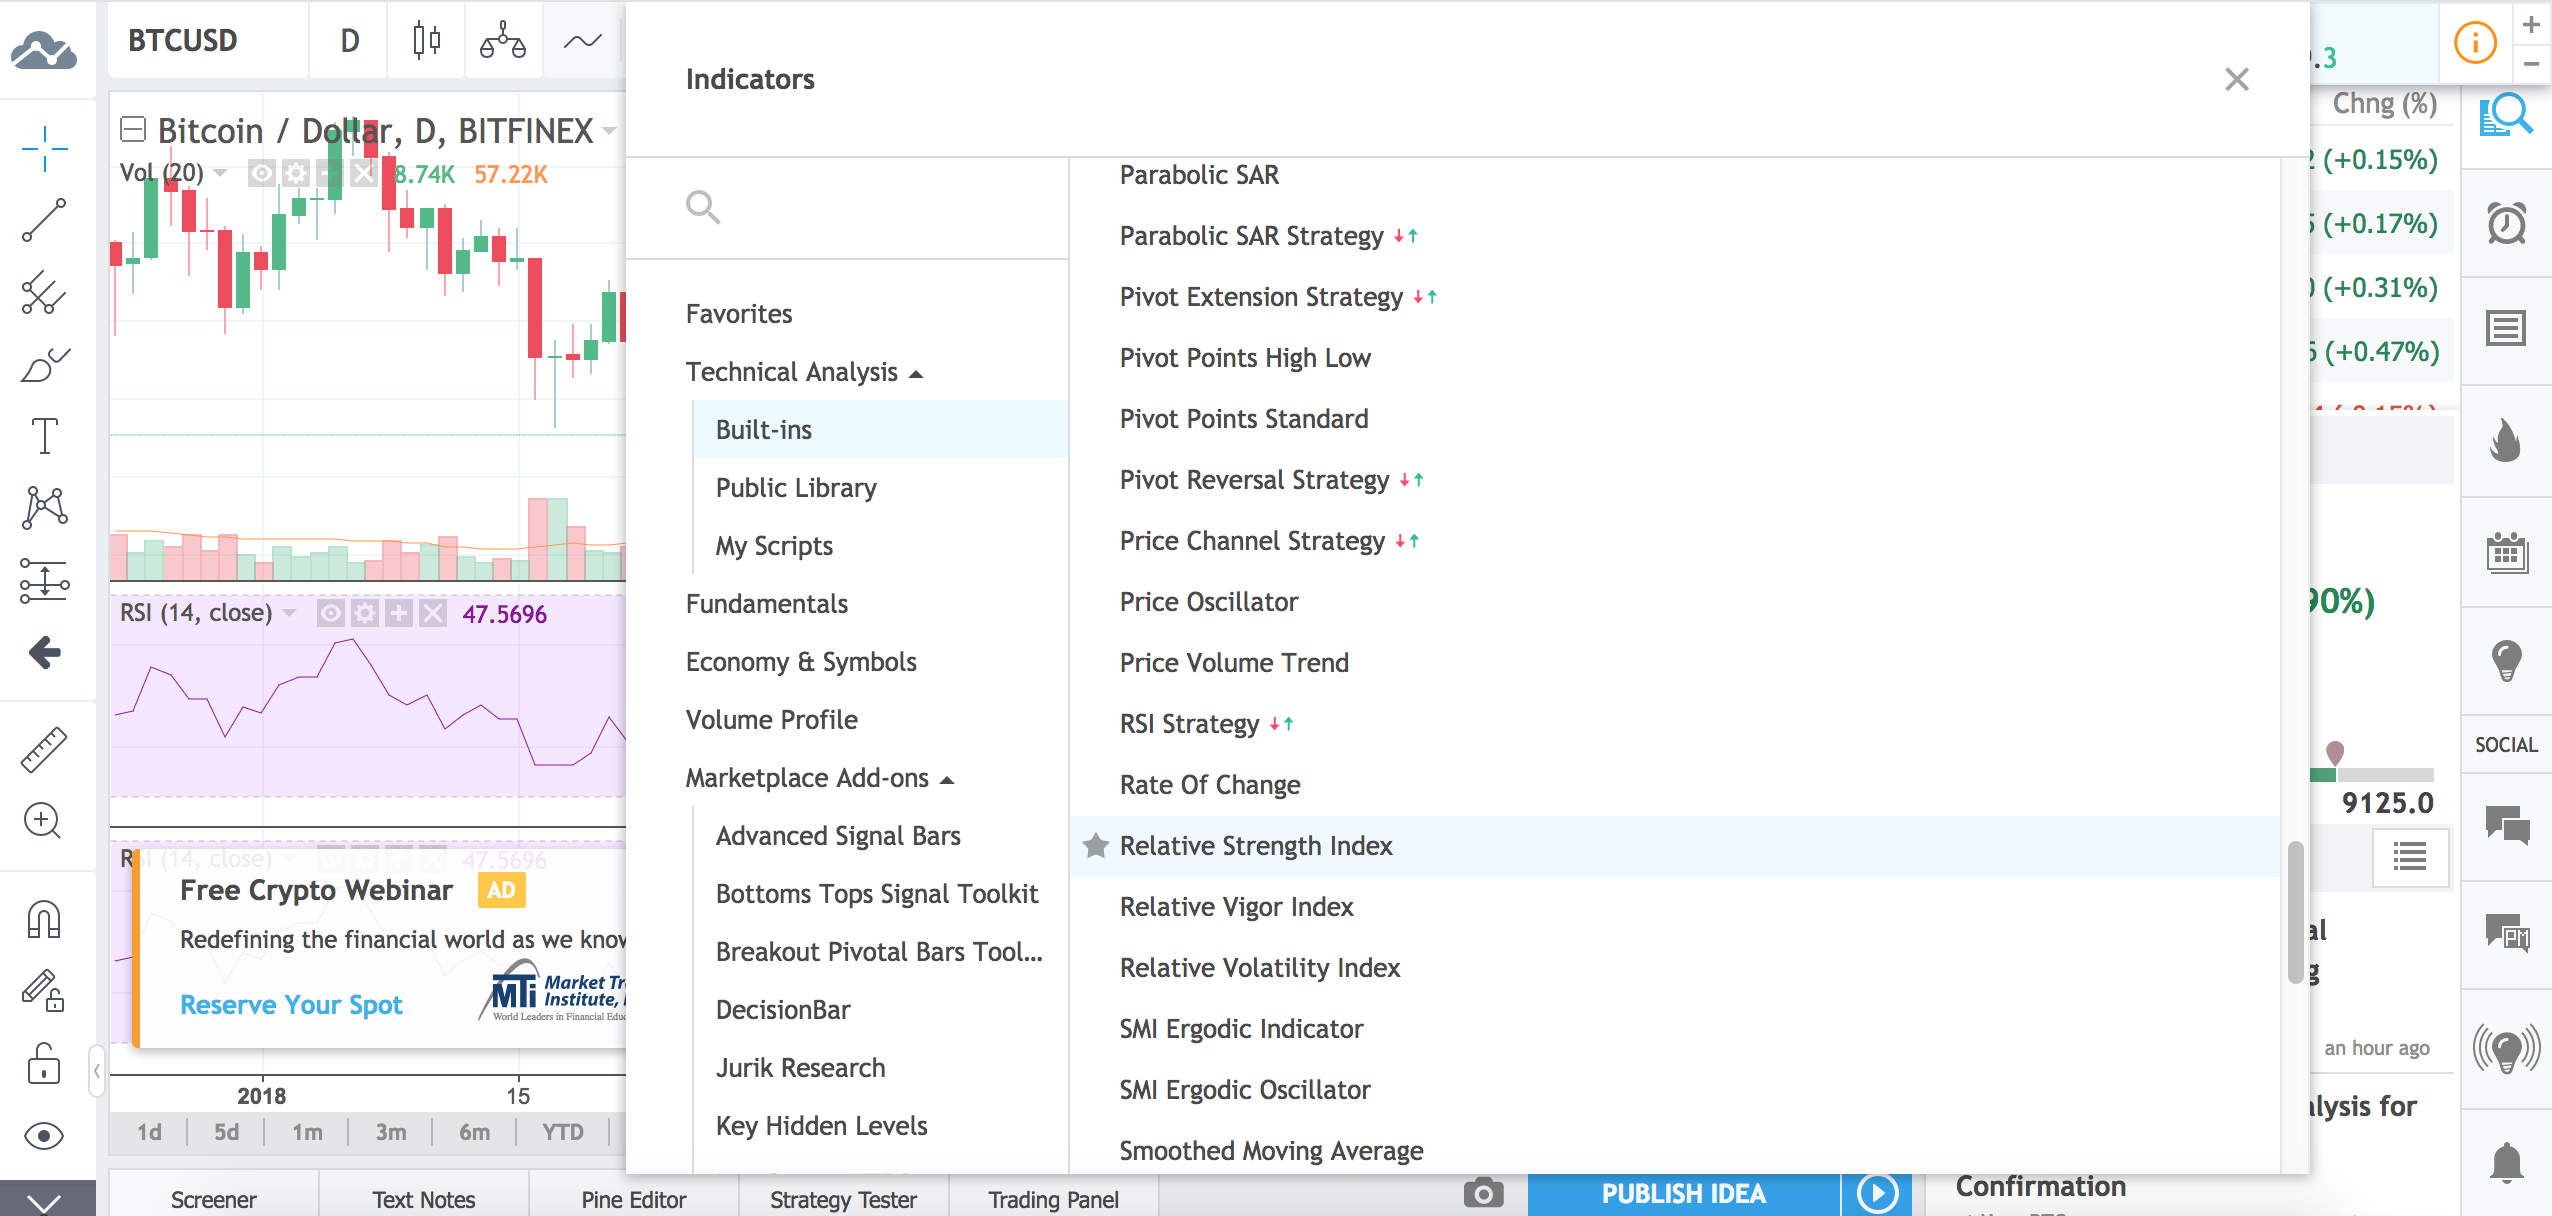
The tool can be found on the 4th tab from the top; the symbol of one wave.
@kevbot
This channel is meant to be my journal of thoughts on crypto, working, traveling, and food. Sourced with photos, videos, and blogs.
)


where do you think neo will hit was holding some and looking at a great exit point ;)
Nice information, What about NEO these days...
Right now, it is oversold on Binance
Nostalgic. In these days NEO is not popular https://9blz.com/rsi-indicator-explained/
slightly bullish finally good to see the market today
My feeling is also sort of in the middle, not sure to buy or sell, so i Hold
you were right bro hope you are doing great in trading today :)
nice information and great analysis
thanks
good one post
It actually changes a lot of time.