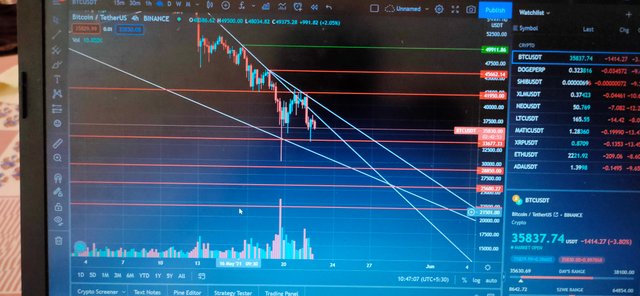
Bitcoin Chart Analysis

Bitcoin is on a consistant downtrend, facing major resistance near $42.5k level,
Resistance of Trendline and EMA.
The downtrend is very much visible on bigger timeframes and may continue to exist until we get a nice volume.
We might se a retest on $25k-$26k level again.
Also, Bitcoin dominance is increasing might lead to bleed in altcoins.
So, if you are in alts and you are in break- even, profit , or even at a minimum loss of 10%. You can exit in alts.
Wait for some dip entries or place some dip entries on supports.
If you want me to chart certain altcoins and tell you exact entries.
Follow me. And comment below.
Also, don't forget to upvote.
Thank you.
