BTC/USD price analysis: Bulls regain upper hand, dip buying campaigns eyed
Factored in: Daily Candle, Volume, Fibs, Trend+Horiz Lines, Cycles, BCH
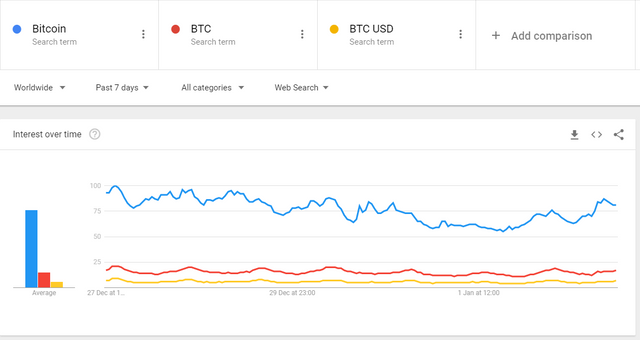
- BTC price action aligns with Google trends, BCH, volume.
- Any retracement should be percieved as a buying opportunity.
- Acceptance near 15k is a developing bullish event.
- Projected short term target around 16.4-16.6k.
The price action in Bitcoin reveals a developing bullish context, fully confirmed by the close above 14k in NY trading. What's more, google trends on bitcoin-related keywords have picked up renewed momentum, while the rise in BTC comes in tandem with a reduction in BCCBTC, reinforcing the move higher. Additionally, the volume on Jan 2nd has been substantial, based on Bitfinex platform as a proxy, suggesting renewed commitment.
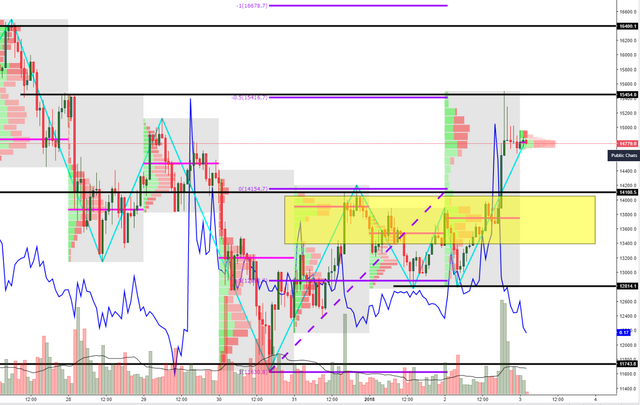
The area in yellow has become a key zone where an outbalance of bids is expected should a setback on profit-taking occur, as buyers are not confronted with the psychological 15k level. Note, this yellow rectangle is where an accumulation of POCs lie. For now, the fact that acceptance has been seen near highs is a clear communication that the buying has substance behind. The accumulation of traded volume near 15k reinforces the notion that any retracement towards 13.5k-14k will see bids reinstated as value was built higher.
The successful rotation from Jan 2nd double bottom has found resistance at 15.5k, where major offers lie as reflected by the large pin candle on the hourly. Based on the latest Dec 31-Jan 1 swing high, the respect of the 50% fib retrac which resulted in the aforementioned double bottom allows us to draw the projection of the next targets, as depicted by the fibonacci extension at 15.4k (first target met) ahead of 16.4-16.6k (100% proj + horiz line).
In terms of current cycle patterns, represented via the zig zag lines, we are entering a 2nd bull leg out of potentially 3 upmoves, which usually tends to be the most bullish as the structure of the 1st leg has now been confirmed, thus providing more reassurance to engage in long-sided business campaigns.
The bearish case scenario will only materialize should an acceptance of prices sub 13.4k be seen, in which case, 12.8k is the immediate support level, followed by a larger setback into the 12-11.8k vicinity. At this point, however, the chances of sellers taking back control are not the greatest barring any major fundamental driven event, in which case, technicals tend to be temporarily thrown out of the window, as explained in footnotes.
Disclaimer: The information contained herein is not guaranteed, does not purport to be comprehensive and is strictly for information purposes only. It should not be regarded as investment/trading advice. All the information is believed to come from reliable sources. The creator of the content does not warrant the accuracy, correctness, or completeness of information in its analysis and therefore will not be liable for any loss incurred.
Footnotes:
Given the discrepancies in price levels on different exchanges, which may lead to arbitrage opportunities, in order to keep our technical studies consistent, the chart selected for analysis will always be the dominant by trading volume. Readers should extrapolate mentioned levels to own respective charts. You can see the name of the exchange on the top left corner of every chart.
The zigzag indicator is utilized to represent the latest cycles in the market. Markets tend to move in cycles of 3 followed by a period of distribution and/or accumulation. Market Cycles are repetitive patterns that provide both market magnitude and timing studies in a very dynamic analytical approach.
The volume profile analysis tracks trading activity over a specified time period at specified price levels. The study reveals dominant and/or significant price levels based on volume. This process allows to understand market opacity. The yellow rectangles in the chart represent the areas of most interest by trading volume, and should act as walls of bids/offers that may result in price reversals.
Technical analysis is subject to fundamental-led news (one should see both components as inter-dependent). Any unexpected news on a specific project may cause the price to behave erratically in the short term, while still respecting the most distant price references given.
Congratulations @ivo333! You received a personal award!
You can view your badges on your Steem Board and compare to others on the Steem Ranking
Vote for @Steemitboard as a witness to get one more award and increased upvotes!
#bitcoin
bitcoin prices will go up you should not be sold first
#bitcoin
why people talk about bitcoin