Do you think this chart is bullish or bearish?
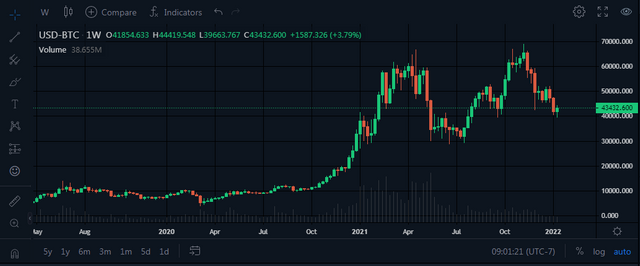
This is a weekly Bitcoin chart, and it appears to be bullish...
What do you notice when you look at the chart below?
Do you see a double top and a price reversal?
Or, in the context of a longer-term bull market, do you see a higher high, a higher low, and the price potentially putting in a bottom here?
If the price stays around $40k, this chart looks pretty good to me.
If we lose that $40k level, the chart will look much weaker, but it won't be over until we also lose that $30k level.
I will remain bullish in the medium term until that happens.