Oh god...I could throw up...
Not because of the beer I'm drinking...or the Thanksgiving dinner I ate. It was delicious btw.
See...I just looked at the BTC/USDT chart.
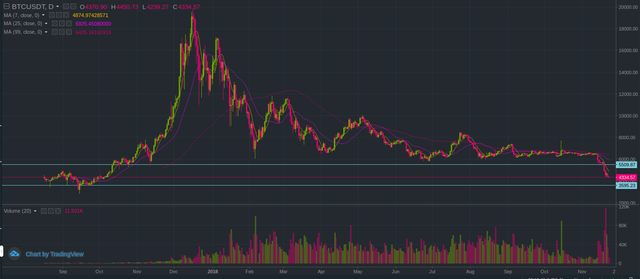
I don't often look at BTC. For whatever reason, I find it a lot more annoying to trade than other cryptos. It's far more stable. But some rare times, I check it out to see how it's doing, because for whatever reason, other cryptos seem to follow it.
Well, we're all probably well aware that cryptos have been down. So now's the perfect time to check the chart to see what we're in store for, right?
Oh god...why did I look...
Well, at least I get to share it with you and make you suffer as well.
I've drawn two horrizontal support lines on here, just cuz. The upper one shows the most recent support that BTC ripped through and the lower one shows the only one visible with this daily chart below it. There might be more ones in there that are farther back in time. It looks like there might be one just above the lower one that I drew.
Lemme draw it in for you.
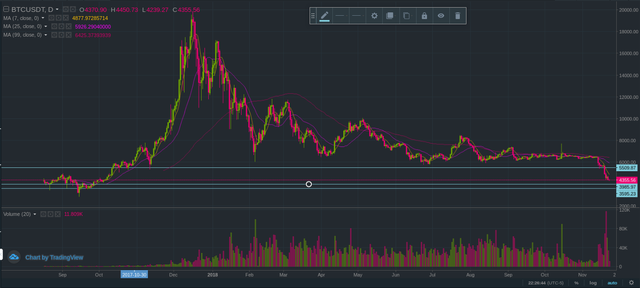
I don't know how strong it is without going to some other charting software with a longer history.
It's really annoying that Binance cuts it off in Sept of 2017. That's barely any history for a trader to go on.
I like Binance...but some things about it really fucking annoy me...
From what we can see, that one line just above the bottom one doesn't look that strong. But both of them look like they could potentially be where BTC goes in the best case. Crypto doesn't often just go down and not hit a support line. Of course, it could just hit the support and bounce right back. It does that sometimes.
Of course, we can also put in a "trend" line. Bound up the decline in a nice little upper and lower bounding line to make a nice stupid little triangle like object.
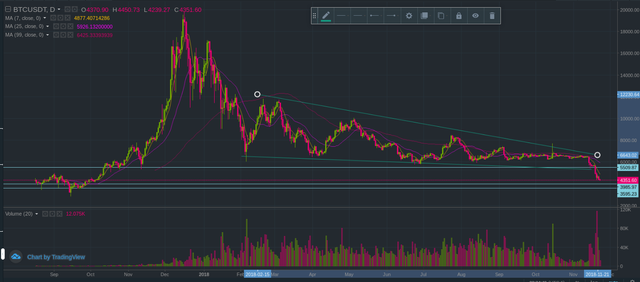
Make fun of them or not, they actually for some reason do seem to work with these type of movements in the charts.
You can see the chart clearly shows the price bounding off the sides of a triangle like shape. Then BTC plunges. Does this mean that we're in for a lot more pain? Or is it just a feint? Will it bounce off a lower resistance line?
Lets look at the weekly chart...
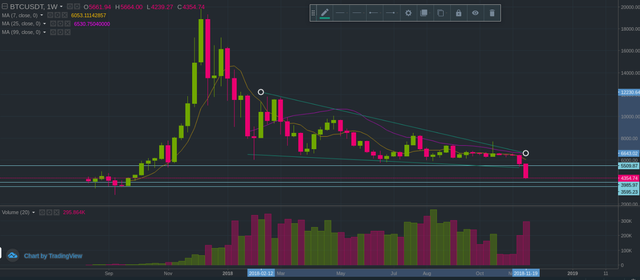
Same thing...
Lets check out Yahoo Finance. I've started using their app after I was impressed with their crypto commercial, and I rather like it.
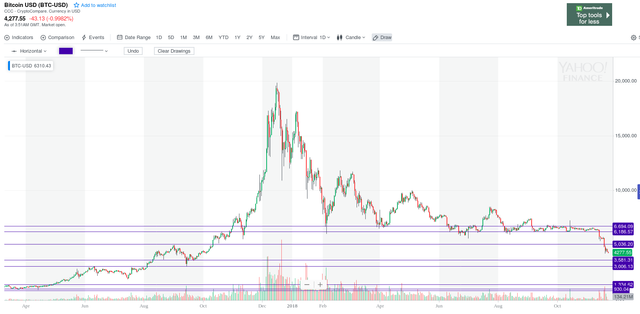
Okay, this is a lot better.
I've drawn quite a few resistance lines where the price bounced off and tended to ride along. As you can see, it looks like we might be in for at least $700 lower drop in price. Hopefully we aren't going to go down anywhere near $1000...
FFS...
Thank you for being here for me, so I can be here for you.
Enjoy your day and stay creative!
Botty loves you. <3
In the midst of this bloodbath, I just cheered myself up by taking a look at my estimated account value on Steemit - some bug in the system has me at $22 Billion...I think you're at $120B!!!
I should show it to someone really stupid and get a lambo on credit.