Research Using CoinMarketCap
With the increase in new users, digital asset prices have been on a strong "bull market," or upward trend. There are currently more than 1,000 altcoins available and the online hype can be overwhelmingly distracting. It's absolutely necessary to do your own research into coins and companies that you might consider investing in. There are two well-respected methods of valuation discovery; fundamental analysis and technical analysis. Technical analysis (TA) uses charts and indicators to predict price movements. This typically requires years of experience to achieve a level of accuracy that is better than luck. The percentage of professional stock-traders, who are new to the cryptocurrency market, is fairly low, so TA would not be as helpful for a basics course.
Fundamental analysis is an evaluation of the company, from a business perspective, to determine what the value of a project is. Most people can recognize an in-demand product, a solid company vision or a high-profile team. These are the factors to look for in a start-up or investment, and learning how to find this information is made easier by the internet and sites like:
Coin Market Cap is a website dedicated to tracking global cryptocurrency data and providing a portal to relevant information on each asset. They have a lot of information, but the first area you should look at will provide you with a big-picture perspective:
At the top of the home page you will see:

The global market cap listed here is the sum of the individual market capitalization for each cryptocurrency. The total value of every altcoin, at the time of this screenshot, was just over 550 billion USD. By comparison, the global stock market value increased by $9 trillion in 2017. That leaves a lot of room to grow, and as you can see, there are almost 1,500 altcoins trying to see those gains. Coin Market Cap provides the tools to learn about each one. *Note: not all cryptocurrencies are listed on this site, but to my knowledge, they have the most extensive list.
Click the global market cap link to get access to more in-depth analysis of the overall market. Charts in this section provide perspective on how the market is moving and where it might be heading. Here you can see the overall market cap had remained fairly stable until mid-2017, when it experienced an exponential growth pattern. At the beginning of 2018, a strong correction is clearly noticeable. This is a common pattern throughout all markets. A big move up, followed by a dip, is referred to as a cycle.

Market cap isn't the only figure to consider for the direction of the crypto market as a whole. The weight each coin carries, based on market cap, is reflected in this chart:
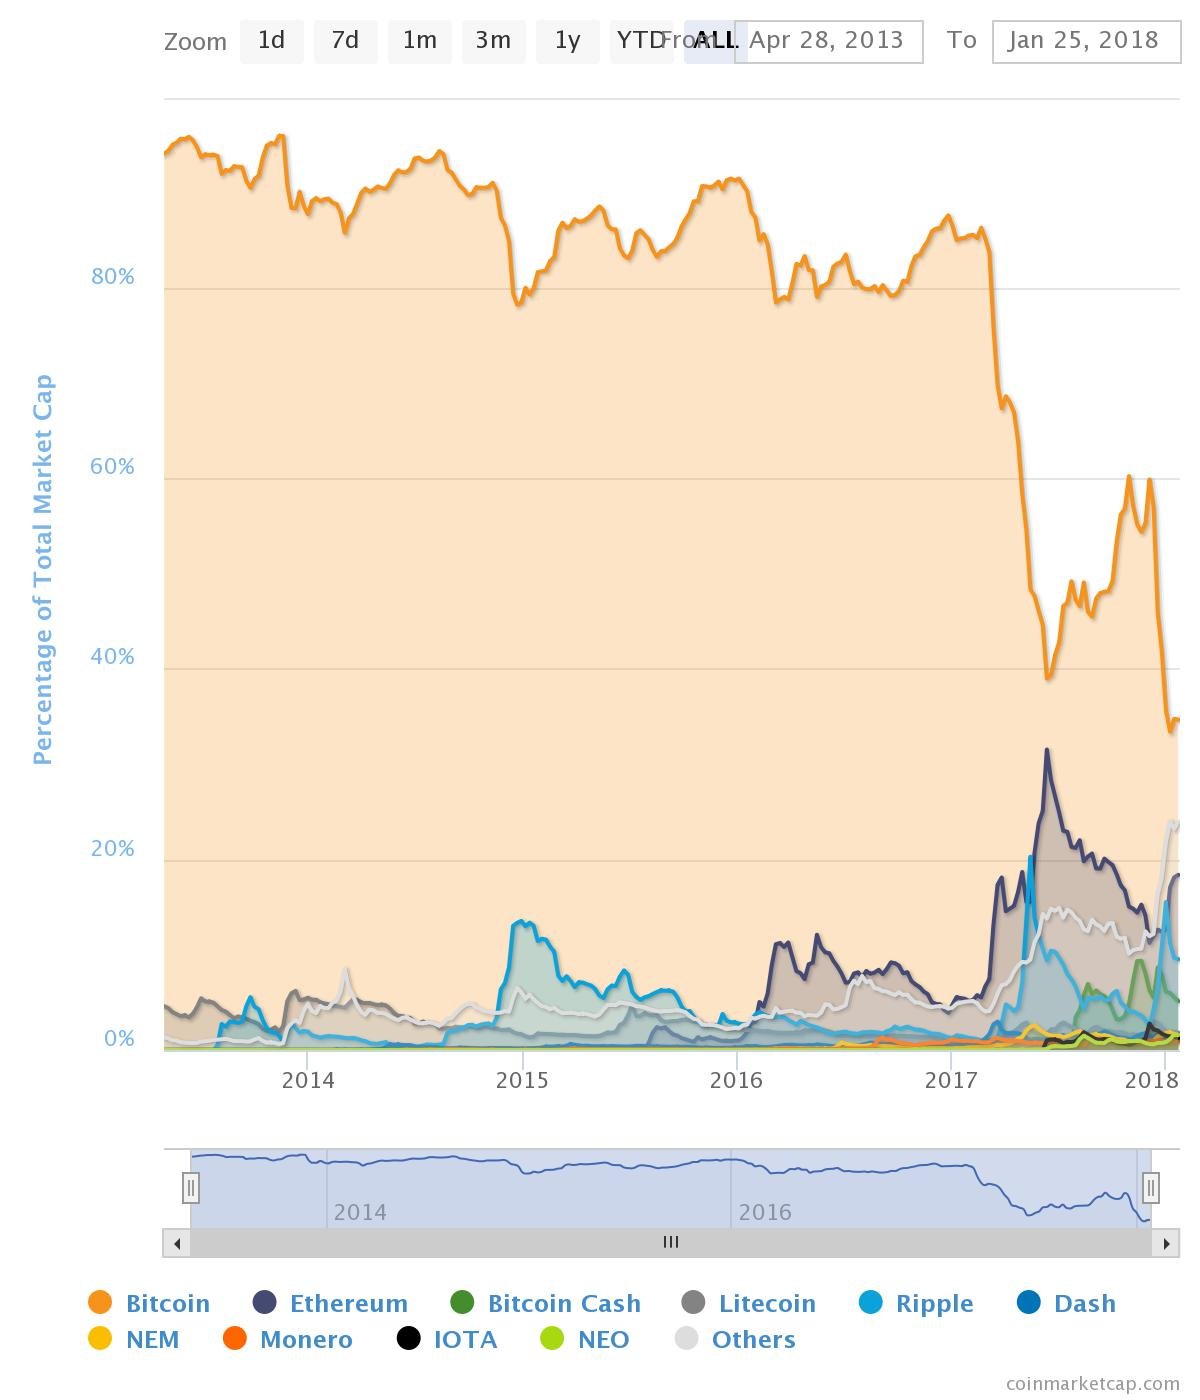
As indicated in the legend, the large orange area is the Bitcoin dominance of the markets. For several years, Bitcoin had no competition in terms of market share, however the rise of altcoins is putting serious pressure on BTC to stay on top.
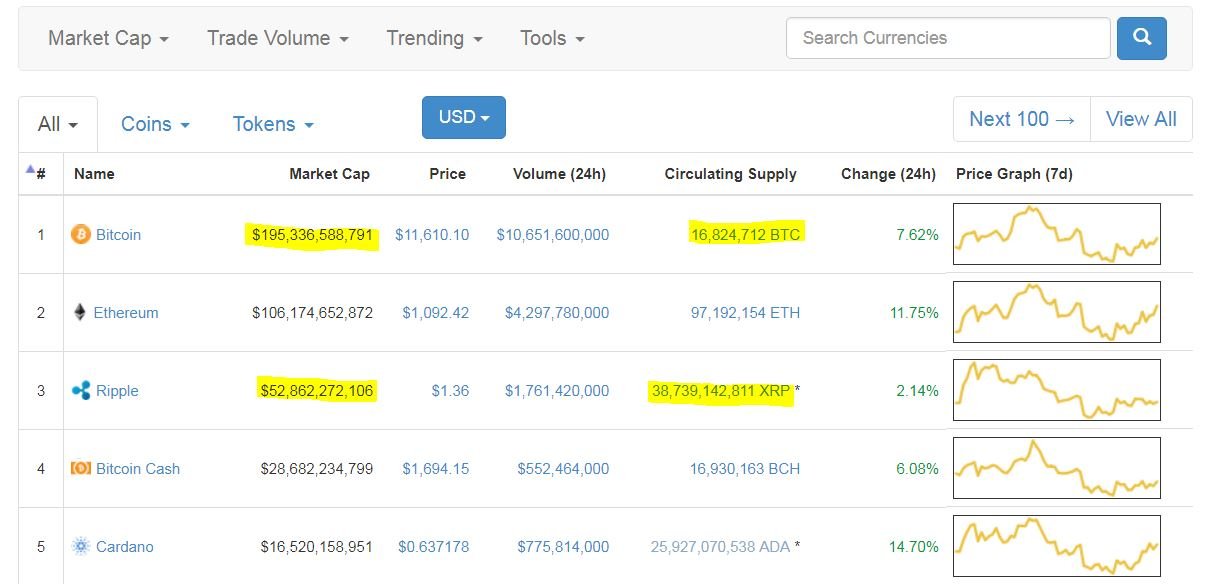
There is more to browse through in the global market analysis, but for investment purposes, researching a specific coin in great detail is more important. Going back to the main page, you will see a listing of the top 100 coins by market cap.
Market cap is figured by (circulating supply x price = market cap). I use the market cap of $250B to figure out the future price at constant supply, but you can set your own standard. Take 250B and divide by the supply, that is your price estimate if the asset ever reaches a quarter-billion dollar market cap. Logically then, if the supply of coins is high, the price will be low. (if Ripple had a supply as low as Bitcoin, its price at that market cap would be around $3000).
By selecting a coin, you are taken to a detailed profile. This will provide links to any associated sources for quick reference.

The Website link redirects to a projects website, if one is available. Diving into a companys site is the next step to researching a potential investment, and the subject will get a proper review. For now, some things to consider:
- Platform/Tech - do they have a product or service? If not, how long until they do?
- White paper - what is the overall vision? what are the projections of task completion and financial return? Has it been plagiarized?
- Roadmap - How quickly have they implemented updates? Are the future goals relevant and innovative?
- Team - Who is involved? What is their track record and combined experience? Does the team have a wide skill set? Is there a dedicated team at all? LinkdIn or Github profiles.
Announcements will take you to Bitcointalk.org, a popular forum where developers and crypto enthusiasts can interact online. The Message Board links will often take you there as well, however, some companies have diversified or utilize one of their own. These forums enable anyone to have lengthy conversations with their favorite team. Chat will redirect you to Slack, Telegram or some other live message application.
The Explorer link is a blockchain tracker for anyone interested in mining or auditing transactions on the blockchain. It's a very technical look at how the blockchain operates and performs under various conditions. For the average investor, this won't be much of a factor towards the evaluation of a company.
Source Code will be available for the assets that have some form of open source application or software development kit (SDK). Links to GitHub.com can provide insights on how often the code is updated, what projects are in development and who is working on particular elements. For the tech-savvy who can follow the jargon, this is a decent way to determine the long-term value of a digital asset.
Below the basic information is a tabbed table. The Chart tab is a linear graph of the price and market cap movement for that asset, over various time-frames.

The default is set to display the ALL (lifetime) charts, with options to narrow down as far as a daily scale. Going through each interval can be helpful in determining short and long-term trends. Remember, this is a rough evaluation. More in-depth analysis will come into play later, but this can quickly weed out poor performing altcoins and save you time in the long run.
On the same table as the charts, is Markets. This lists all the trading platforms you can find each token. Exchange listings also have a dedicated page in Coin Market Cap, ranked from highest volume.

Another tab, Social, will highlight any posts made across these mediums. Companies that have a strong media presence will often go through spikes when news or updates get posted. Reddit, Twitter, Facebook, Steem, blogs of every kind; it might not be a major factor in your decision making, but if the project is something you love, you'll be able to find like minded people to interact with.

For anyone looking to promote or track a coin, many companies offer widgets or APIs in the Tool tab. Place a static ad or price ticker on your website or blog.
Finally, the Historical Data tab is accurately named, past data is cataloged by day and lists basic information; high, low, volume, etc. A drop-down allows you to pick any day for the life of the asset.
Coins mentioned in post:
Thank you to whoever wrote this bot!
Great information. It amazes me how many people don't understand the market cap stuff vs coin supply so they think a $1 coin is cheaper than a $10 coin so a better buy just because of the actual price per coin.
Right! My forehead hurts from all the smh :) Thanks for reading!