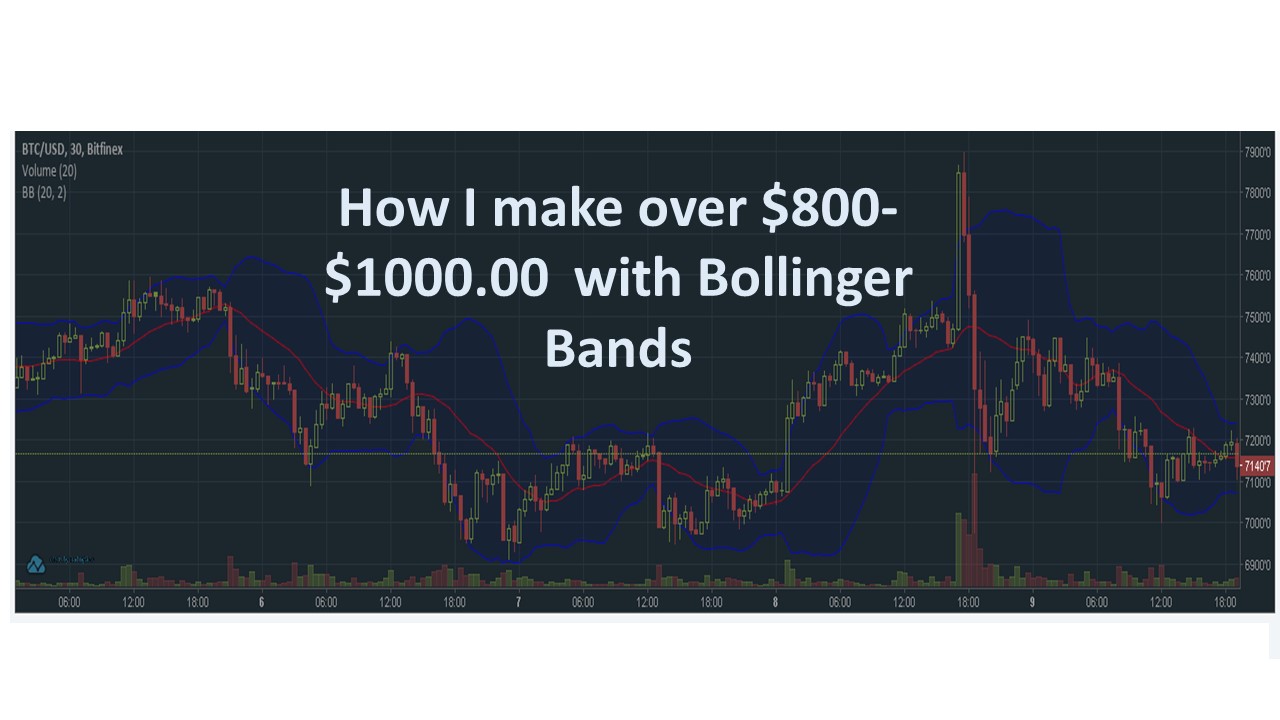
Crypto Traders How I make $800-$1000 with these Bollinger Bands Strategy (Strategy 1 of 10)
Bollinger bands explained:
So what are they and what’s their purpose?
Bollinger Bands provide a relative benchmark for price highs and lows, they offer a statistical perspective on asset price movement.
So;
Prices are high at the upper band and low at the lower band relative to the simple moving average of the previous market action.
The infamous Black Scholes Model possessed the same statistical characteristics as Bollinger bands in their capacity to indicate a relatively over or under priced security.
There have been numerous tests and statistical studies of the effectiveness of the application of Bollinger bands to trading financial instruments.
The bands are a measure of how far price is from a simple moving average. The upper and lower band are both set at 2 standard deviations away from that simple moving average.
If the price begins to push in the direction of the upper or lower band it could be an indication of the market beginning to trend in that direction.
And that is the value of a Bollinger band strategy right there!
Getting an indication of a trending market could help you ride the trend to its completion.
Bollinger bands on a chart: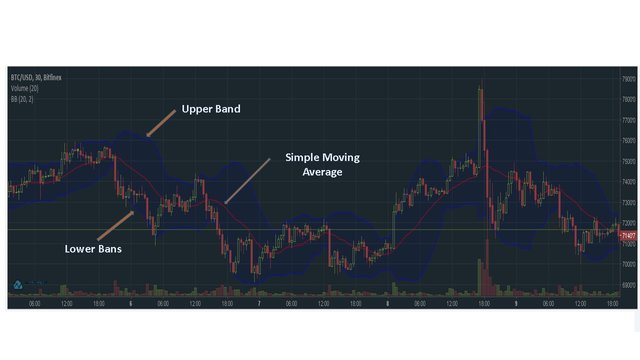
The particular settings are up to the individual trader It differs from person to person.
But the standard Bollinger band formula is:
A 20 period simple moving average.
The upper band set 2 standard deviations above the MA.
The lower band set 2 standard deviations below the MA.
And there you have it, set up and ready to go.
Bollinger bands strategy 1:
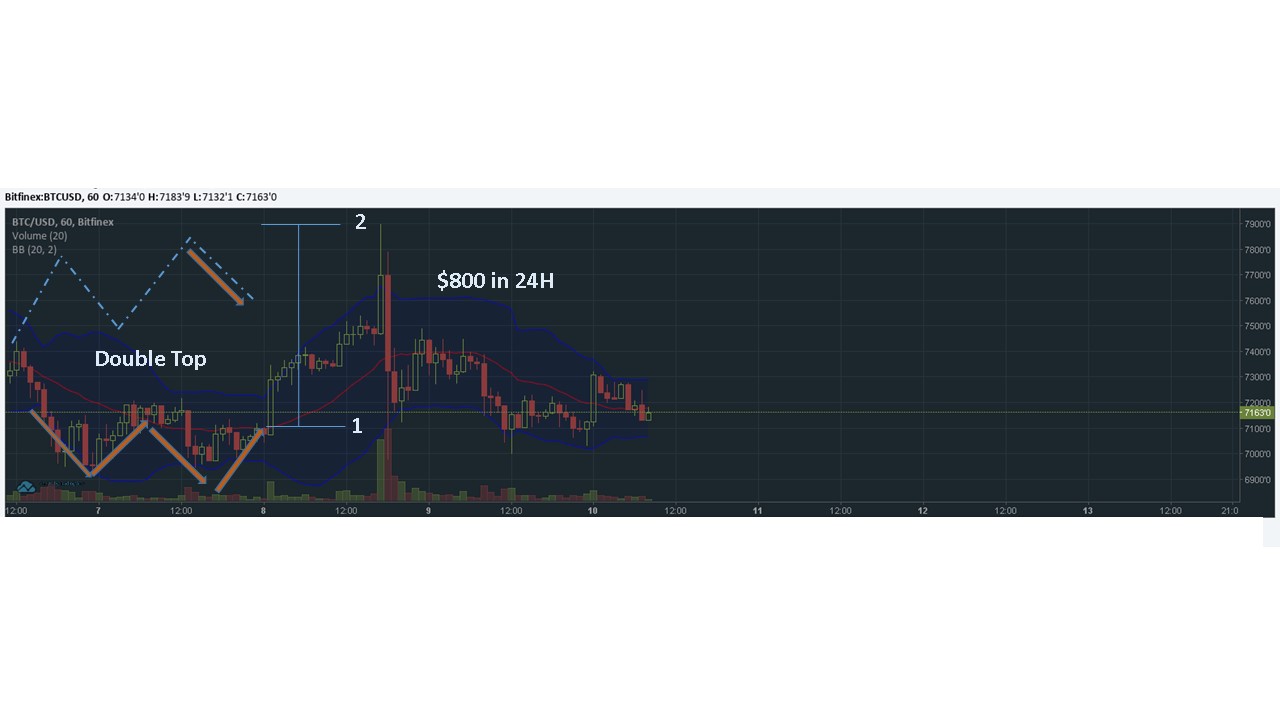
Double bottom formation:
The opposite will also occur regularly at significant lows.
Where prices drop to the bottom band twice in short order and then are repelled upwards, beginning an uptrend in the market.
In the chart above two W patterns formed in the uptrend, adding weight to the trend and signifying that a trader should stick with the trend.
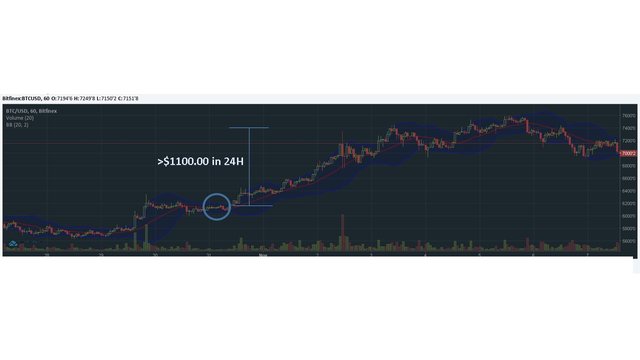
There is a four step process in this Bollinger bands strategy to confirm a W bottom is in place.
Firstly a low forms, usually below the lower band.
next a retracement to the middle band.
then a new low forms but will hold on or above the lower band showing a slowing of downside momentum.
And lastly, the pattern is confirmed when the price rallies to the upper band and completes two candles whose real bodies are above the middle band.
A trader should always wait until all of the four steps are complete before trading the move. this will reduce false signals and spare your capital in the long run.
I will commonly use a stop loss order to trade this setup, using the higher ‘price low’ of the formation as the stop loss position.
NB: You will notice that I have not shared how to find the perfect entry and exit points. If you'd like more info on how to find the points of entry and exit, then share this post, and up vote it. Unlike other traders that are charging you for information, I simply ask that you like and share if it added value to you , since I will be helping you to make some profits.
Bollinger Bands Strategy: Strategy 2 of 10
Congratulations @cybermechanic! You have completed some achievement on Steemit and have been rewarded with new badge(s) :
Click on any badge to view your own Board of Honor on SteemitBoard.
For more information about SteemitBoard, click here
If you no longer want to receive notifications, reply to this comment with the word
STOP