Bitcoin Price Update - August 19, 2018
Bitcoin Price Update
August 19, 2018

Join our trading community on Discord!
Subscribe to us on YouTube to grow your trading knowledge!
Can you feel that excitement in the air? It is times like this that really make being a crypto trader exciting. It's times like these that mark the difference between recreational and dedicated, that show the delineation between how this passive time of slow decline (ie: bear market) has been utilized by individuals. It's easy to become stagnant and inactive during such times, yet that is exactly when we need to be the most disciplined. Times of rapid growth, bull markets, like what we saw in 2017 do not a disciplined trader make. It's easy for anyone to make money in such an enviroment, regardless of what strategy they use. It's only when all the money starts to wash away, and you start to see your account taking heavy red losses on a daily basis that discipline and strategy become not just tools, but necessities for survival.
So how did you spend the last few days? Did you allow the profit to slip away from you? The last three days showed an incredible opportunity for profit. Are you a recreational trader/passive investor or are you trying to live that BitMEX lifestyle? If you're the latter, then you probably got very little sleep over the last 72 hours as trading has been fast and furious. Yesterday let the wind out of the sails of those calling for ATH's (as they always do when price moves $1 to the positive...) however looking at the tentative stats this morning we could see another sea of green again.
Are you going to capture this moment, or let it slip away?
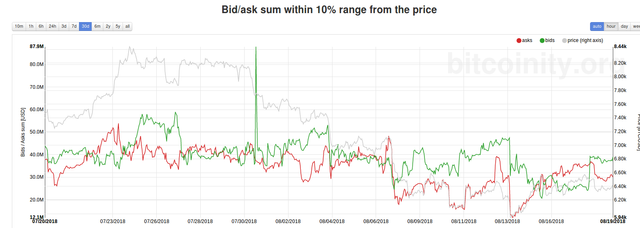
Bid Ask Sum

Bids have moved above asks again,made most noticeable by a relatively large spike in a one hour period. It's not a fairly large spread, or a very large amount, volume remains fairly low so far this morning, but it is a positive sign. Again, Bid/Ask Sum has a extremely reliable corollation to price action. When asks rise, it is a bearish sign. When bids rise, it is a bullish sign.
Bitfinex Longs vs. Shorts
As above, volume is relatively low. We can see here that shorts are slightly in excess of longs. I want to elucidate the effect I've noticed this to have on price. This is in the vein of the philosophy I approach the markets with, Wyckoff Accumulation/Distribution. However if you apply the indicator, or just look at the data, and look at it's effects on price action, you'll see without a glimmer of deception that what I'm saying is correct. When shorts spike in a noticeable fashion, price moves upwards. Yes, the exact opposite of what you would expect. Conversely, when longs spike noticeable price moves downwards.
This is the same theory as a selling or buying climax. When everyone (relatively) has bought, there are (relatively) no more buyers to combat the sellers, and the sellers can push the price down with ease. Conversely, when all the sellers have done all their selling, there's no more sellers to depress the price from the buyers bidding the price back up. So you look to make the opposite move when you see longs and shorts spike noticeably.
Chart Analysis

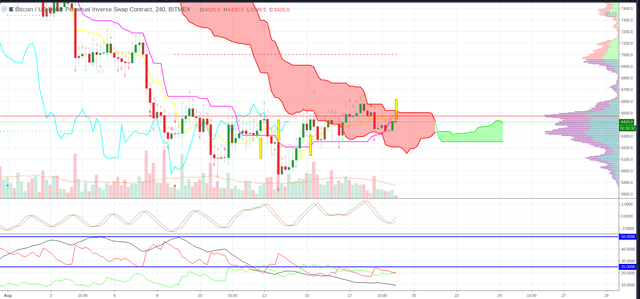
Looking at the 4hr chart today.
Price has been consolidating around the POC as indicated by the Volume Profile indicator. This means price is consolodating around a price range of heavily traded volume, meaning buyers and sellers feel this is a fair price for whatever reason. It merely indicates a price level at which sellers are comfortable selling, and buyers are comfortable buying.
DMI shows us a weakening in trend, or to be realistic the complete lack of a current trend. Price is ranging atm, waiting for a move in one direction or another. I feel more confidant of an upwards move, but am awaiting a stronger indication to place a trade on it.
Ichimoku shows us price ranging around inside the cloud. However, the future cloud is twisting upwards and has turned green, a good sign. We're hitting resistance of the top band of the cloud, combined with both our Tenkan and Kijun moving averages. A breakthrough at this moment is possible, but I feel it more likely that we'll see an intial rejection followed by longer consolidation around the POC (the red line on my chart) before we gather sufficient momentum to break through and trend above the cloud. I expect the DMI to strengthen as a positive indicator at the point as well.
TD Sequential shows us still in a Buy Countdown. The last nine count we experienced was a Buy Setup that concluded back on the 10th, so we've enjoyed a weak of ranging price action and we look forward to a completion of our buy Countdown to give us a stronger reversal signal.
Reccomendation Action
I don't see a Bitcoin trade on the table at the moment. It's still too early in the day. I see positive signs of consolidation that can lead to a break to the upside. I'm not seeing strong signs of capitulation, so I'm neither looking to short or sell at the moment. If your'e looking to accumulate, this is a good price to do so. I am waiting for a stronger reversal sign, a volume spike, a spike in shorts, or a stronger rising of bids before I am confident to place a long position on Bitcoin. Let's see what the day brings!
Altcoins? Looks like it could be a strong day for them. Take your pick, when altcoins do well they almost all do well. We'll be taking a closer look at them later on today.
Sincerely,

Join our trading community on Discord!
I'm not a financial adviser. The information here is for education purposes. Trading and investing are wonderful things to do, and it's OK to take advice and to learn. I'm glad you're here right now reading this, educating yourself. Don't take my word as the gospel, and be careful. All investment and trading opportunities carry risk, I'm sure you reading this have the potential in you to profit from a careful trading plan, and wise investment choices. Do it right, do your research, and don't trade stupid. Very best of luck to you!.
