(Trading) "4th BEST BTC short in all my life" (psychological / TA lessons and other things)
𝒉𝒆𝒍𝒍𝒐!
I'll write a lot because it's my first post here about Trading and I just love it, this article is meant to help
Every one of us traders have seen the highs and the lows of the 𝐵𝑇𝐶, in my own opinion/experience I've seen it from the two sides, the loser and the winner, but that's not the point, when you do a trade, you hope for the best
If you are "𝒏𝒐𝒐𝒃" you struggle, you lose your patience, you pray to the god you believe "STOP FALLING"
and you pass through a lot of pain, when you experience that, you are doing it wrong... trading is not like that
𝒕𝒓𝒂𝒅𝒊𝒏𝒈 𝒂𝒔 𝒍𝒊𝒇𝒆 𝒊𝒔 𝒔𝒊𝒎𝒑𝒍𝒆, 𝒘𝒆 𝒂𝒓𝒆 𝒕𝒉𝒆 𝒐𝒏𝒆𝒔 𝒘𝒉𝒐 𝒎𝒆𝒔𝒔 𝒖𝒑 𝒂𝒏𝒅 𝒄𝒐𝒎𝒑𝒍𝒊𝒄𝒂𝒕𝒆 𝒕𝒉𝒊𝒏𝒈𝒔
We just have to study and stick to the plan, the strategy, search for a good trading strategy that fits our personality, our capacities, our patience and discipline, 𝒕𝒓𝒂𝒅𝒊𝒏𝒈 𝒊𝒔 𝒏𝒐𝒕 𝒂 𝒋𝒐𝒌𝒆, there are people that have to study like years, there are others that just only in months reach their goals
𝒑𝒓𝒐𝒇𝒊𝒕 𝒄𝒐𝒎𝒆𝒔 𝒂𝒍𝒐𝒏𝒆, 𝒚𝒐𝒖 𝒉𝒂𝒗𝒆 𝒕𝒐 𝒍𝒆𝒂𝒓𝒏 𝒈𝒐𝒐𝒅 𝒓𝒊𝒔𝒌 𝒎𝒂𝒏𝒂𝒈𝒆𝒎𝒆𝒏𝒕, 𝒚𝒐𝒖 𝒋𝒖𝒔𝒕 𝒉𝒂𝒗𝒆 𝒕𝒐 𝒍𝒆𝒂𝒓𝒏 𝒉𝒐𝒘 𝒕𝒐 𝒍𝒐𝒔𝒆 𝒃𝒆𝒇𝒐𝒓𝒆 𝒍𝒆𝒂𝒓𝒏𝒊𝒏𝒈 𝒉𝒐𝒘 𝒕𝒐 𝒘𝒊𝒏
Things here are not black or white, green or red, things here are all about 𝒑𝒓𝒐𝒃𝒂𝒃𝒊𝒍𝒊𝒕𝒊𝒆𝒔, the chart, the colors, the sentiment, all of that was made to trick your mind and make you feel useless only because you can't control your emotions or the market itself
just 𝒅𝒐𝒏'𝒕 𝒑𝒍𝒂𝒚 𝒚𝒐𝒖𝒓𝒔𝒆𝒍𝒇
Evolve your trust, trust your AT strategy and stick to your SL (Stop Loss), "𝒚𝒐𝒖 𝒄𝒂𝒏 𝒍𝒐𝒔𝒆 𝒚𝒐𝒖𝒓 𝒐𝒑𝒊𝒏𝒊𝒐𝒏, 𝒚𝒐𝒖 𝒄𝒂𝒏 𝒍𝒐𝒔𝒆 𝒂 𝒕𝒓𝒂𝒅𝒆 𝒃𝒖𝒕 𝒍𝒐𝒔𝒊𝒏𝒈 𝒎𝒐𝒏𝒆𝒚 𝒊𝒔 𝒐𝒑𝒕𝒊𝒐𝒏𝒂𝒍" can't remember where I read those words but they are indeed some powerful ones, people tend to search x1000 strategies because ONE, TWO, THREE times they failed a trade and right away they think that TA is useless, that's so wrong
𝒅𝒐𝒏'𝒕 𝒕𝒓𝒚 𝒕𝒐 𝒃𝒆 𝒑𝒆𝒓𝒇𝒆𝒄𝒕, 𝒅𝒐𝒏'𝒕 𝒃𝒆 𝒈𝒓𝒆𝒆𝒅𝒚, 𝒅𝒐𝒏'𝒕 𝒕𝒓𝒚 𝒕𝒐 𝒍𝒐𝒔𝒆 𝒇𝒆𝒂𝒓 𝒐𝒓 𝒆𝒎𝒐𝒕𝒊𝒐𝒏𝒔, 𝒊𝒏𝒔𝒕𝒆𝒂𝒅, 𝒍𝒆𝒂𝒓𝒏 𝒕𝒐 𝒄𝒐𝒏𝒕𝒓𝒐𝒍 𝒕𝒉𝒆𝒎!
In the next posts I'll do some lessons about Technical Analysis, Fundamental Analysis and Psycological Lessons!
Straight to the point (𝑻𝑨 𝒑𝒂𝒓𝒕 𝒉𝒆𝒓𝒆):
I did this chart some days ago 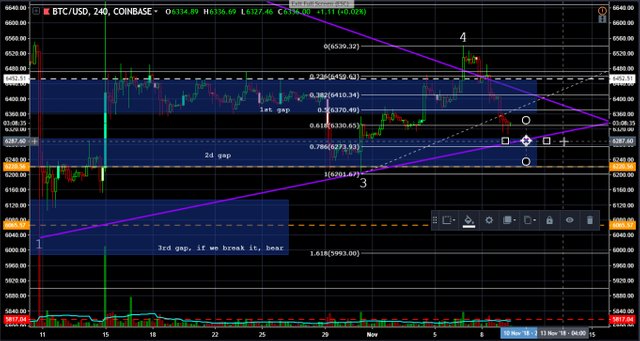
I'll explain quickly:
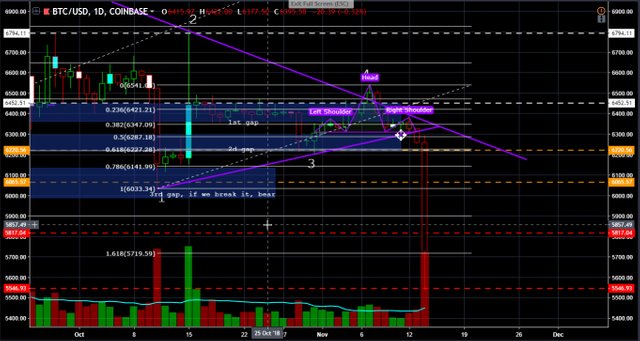
that's a 𝑩𝑻𝑪 / 𝑼𝑺𝑫 chart at Coinbase (4H)
𝒘𝒉𝒊𝒕𝒆 𝒂𝒏𝒅 𝒐𝒓𝒂𝒏𝒈𝒆 𝒍𝒊𝒏𝒆𝒔 are support and resistances.
𝒃𝒍𝒖𝒆 𝒓𝒆𝒄𝒕𝒂𝒏𝒈𝒍𝒆𝒔 𝒂𝒓𝒆 "𝑮𝒂𝒑𝒔" I know that Gap is when the price moves so fast that it leaves an empty space in the chart but I also call "Gap" sites to which I think the price should return
𝒑𝒖𝒓𝒑𝒍𝒆 𝒍𝒊𝒏𝒆𝒔 are the set up of a symmetric triangle and the numbers up and down are the count of 'ceilings' and 'floors'
and at the end almost hiding (joke haha) 𝒕𝒉𝒆 𝑭𝒊𝒃𝒐𝒏𝒂𝒄𝒄𝒊 𝒍𝒆𝒗𝒆𝒍𝒔 (with white levels instead of the default colors)
a little advice here, 𝒚𝒐𝒖 𝑨𝑳𝑾𝑨𝒀𝑺 𝒉𝒂𝒗𝒆 𝒕𝒐 𝒇𝒊𝒏𝒅 𝒕𝒉𝒆 𝒕𝒓𝒆𝒏𝒅! 𝒂𝒏𝒚 𝒕𝒊𝒎𝒆 𝒇𝒓𝒂𝒎𝒆 𝒉𝒂𝒔 𝒊𝒕𝒔 𝒐𝒘𝒏 "𝒕𝒓𝒆𝒏𝒅"
Most of the time you can't trick the 1D indicators and you always have to look at the candles, they don't lie (I use SLOW STOCH, MACD and WaveTrend Cross By Lazy Bear with Default Candles)
Learn to see what the market is telling you and forget that toxic attitude of making decisions base on what you want or need of the market, that kind of things can play against you.
𝑻𝑨 𝒅𝒐𝒆𝒔𝒏'𝒕 𝒍𝒊𝒆, you just have to study 𝑨 𝑳𝑶𝑻 and simplify the things you learn to get an a Idea, all the people are doing and creating charts, with BAT patterns, Elliot Waves, just Resistance and Support levels but if your TA is good enough you'll see the same thing that good traders are seeing
so, the next thing, after 2 or 3 days was this
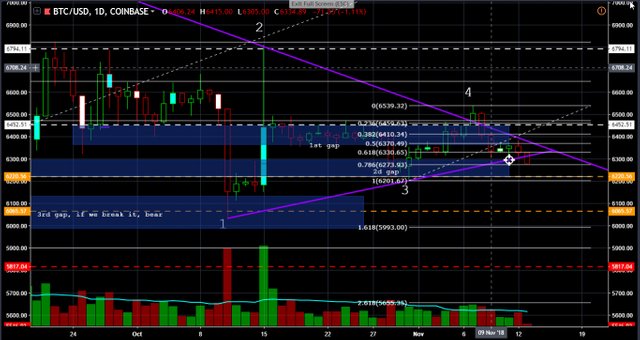
and then I spotted and confirm a H&S bear pattern at 1D before the breakout, that was an easy one, some of the alts where making the same exact pattern
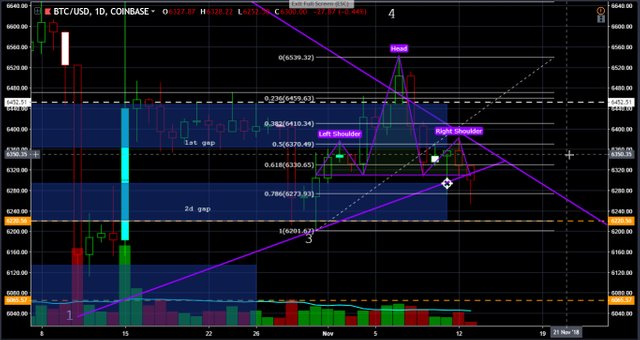
and then
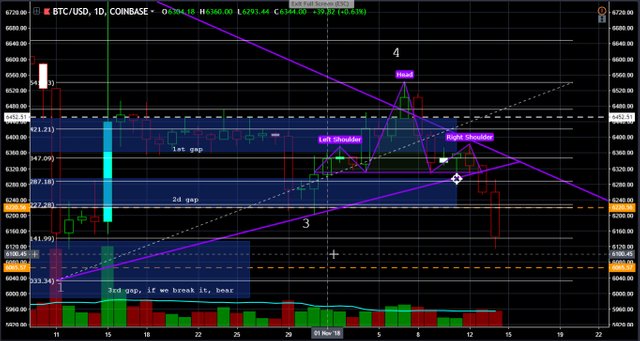
but, to demonstrate my point I did this chart, don't have any screenshot of it point by point because I did it at 𝒑𝒐𝒊𝒏𝒕 𝟒
here it is
a Gann Box (kinda like fibonacci levels) with market cycle wave counts
all the points where made taking the ceilings and floors of the indicators and the gann box
here the example
.jpg)
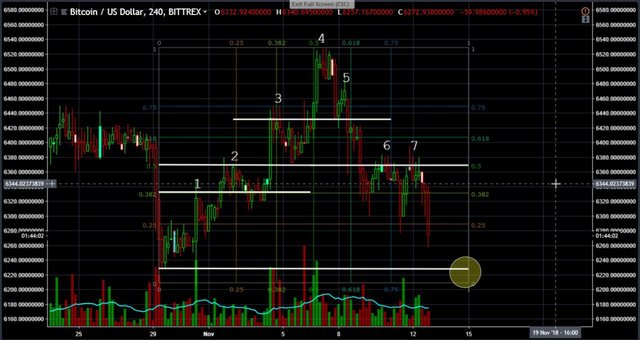
I'll explain quickly, I did that chart when the BTC price was at 𝒑𝒐𝒊𝒏𝒕 𝟒
𝟏 We had our first call at 6.230 USD after making a clean floor at the 3 indicators at 4H TF (Time Frame) then the price had its first spike on vol, that makes 𝒑𝒐𝒊𝒏𝒕 𝟏, then pullback at 6.289 making the old resistance a new support
𝟐 Then after the first pullback the price raised to create the 𝒑𝒐𝒊𝒏𝒕 𝟐 and did a clean pullback to the 𝒑𝒐𝒊𝒏𝒕 𝟏 making some room for accumulation
𝟑 You can clearly see at the 𝒑𝒐𝒊𝒏𝒕 𝟐 that selling vol was very low, that's indeed a call to create the 𝒑𝒐𝒊𝒏𝒕 𝟑 and the first spike before distribution, we did a clean pullback to 𝒑𝒐𝒊𝒏𝒕 𝟐 (you can search market cycle method or wyckoff method to see the first spike before distribution)
𝟒 Right after making the pullback from 𝒑𝒐𝒊𝒏𝒕 𝟑 to 𝒑𝒐𝒊𝒏𝒕 𝟐 the price raised to create the 𝒑𝒐𝒊𝒏𝒕 𝟒 and indeed the distribution point seeing a lot of BUY volume
After scalping all the grow I did want to keep it simple and I charted a Gann Box there, I entered a short position at 6.500 seeing that indicators where exhausted (and at 1D things where weak too I decided to short):
You can see that the MACD was closing below its 0 level (that's bear), the SLOW STOCH was touching the ceiling and the WaveTrend wasn't even touching the ceiling (that's bear because it means that the price don't have momentum)
𝟓 Right after I shorted the price falled to 6.431 and did again a clean pullback back up to make the 𝒑𝒐𝒊𝒏𝒕 𝟓 and the spike after distribution, that's the place when you should sell, you can share that point in other charts, there's no distribution without pullback with less momentum
𝟔 & 𝟕 After the price reaching 𝒑𝒐𝒊𝒏𝒕 𝟓 the price started to free fall to 𝒑𝒐𝒊𝒏𝒕 𝟏 ceiling ( 𝒑𝒐𝒊𝒏𝒕 𝟐 floor) touching the 0.38 of the fibo, that was a good place to do a pullback to 𝒑𝒐𝒊𝒏𝒕 𝟐 (but no to enter a pullback-long position) the price did that twice creating point 6 & 7 making a double top pattern (bear pattern)
with 1D bearish and 4H bearish at the charts with that symptoms I knew this was goin' to hell haha!
What I'm tryin' to do here? not trying to be another "expert", I just want to 𝒉𝒆𝒍𝒑 𝒐𝒕𝒉𝒆𝒓 𝒑𝒆𝒐𝒑𝒍𝒆 𝒂𝒏𝒅 𝒔𝒉𝒐𝒘 𝒉𝒐𝒘 𝒔𝒊𝒎𝒑𝒍𝒊𝒇𝒊𝒆𝒅 𝒄𝒂𝒏 𝒕𝒓𝒂𝒅𝒊𝒏𝒈 𝒃𝒆 𝒊𝒇 𝒚𝒐𝒖 𝒍𝒆𝒂𝒓𝒏 𝒆𝒏𝒐𝒖𝒈𝒉 𝒂𝒏𝒅 𝒔𝒕𝒐𝒑 𝒔𝒆𝒂𝒓𝒄𝒉𝒊𝒏𝒈 𝒂𝒏𝒔𝒘𝒆𝒓𝒔 𝒊𝒏 𝒐𝒕𝒉𝒆𝒓 𝒑𝒆𝒐𝒑𝒍𝒆, you can follow signals, you can enter paid chats, but you've always be two steps behind because you really don't know what's happening
𝑵𝒆𝒗𝒆𝒓 𝒅𝒆𝒑𝒆𝒏𝒅 𝒐𝒏 𝒂𝒏𝒐𝒕𝒉𝒆𝒓 𝒑𝒆𝒓𝒔𝒐𝒏 𝒕𝒐 𝒎𝒂𝒌𝒆 𝒚𝒐𝒖𝒓 𝒐𝒘𝒏 𝒅𝒆𝒄𝒊𝒔𝒊𝒐𝒏𝒔
I'll be sharing TA lessons aside with Psycological facts, books, guides and fundaments to help you improve your trading, scalp, swing, day trade, holder, you need to learn!
hope you guys have a good day! 𝒃𝒆 𝒈𝒐𝒐𝒅 𝒃𝒆 𝒌𝒊𝒏𝒅
any comment is always welcome!
Cuando empecé en el mundo del trading, todo era borroso, confuso, deprimente, algo muy lejano e imposible para mi de comprender y menos aún poder aplicarlo, eso ni pensarlo. Pero desde que tuve el privilegio de toparme con Blvck, todo ha mejorado, no solo en mis trades, sino en mi vida, que es lo que mas me ha impresionado, y probablemente sea el real sentido sobre el trading. Estoy muy contento de poder ser testigo y parte del proceso en el cuál cumplirás todos tus sueños y metas.
Gracias por todo.
¡¡¡NEVER SURRENDER, BRO !!!
never bro!