Statistics for Crypto Traders Part 1: Means and Moving Averages

If you’re like most people, you’re not a big fan of maths and statistics. Still, you probably realize that you can make more money trading if you understand basic statistics. If so, you’re in the right place; this article is about to explain some of the most important concepts and formulas in trading.
- Specifically, we’ll be covering:
- Mean averages
- Standard deviations
- Expected moves
- Covariance
- Correlation
- Range
- Portfolio calculations
We’ll start with the single most common formula in trading: the mean.
Mean, Median, & Range
Many people don’t know this, but there are three kinds of average numbers.
The median is the middle data point in a data set. The mode is the most frequently found data point in a data set. The mean is the sum of all data points divided it by the total number of data points.
When we talk about averages, we’re almost always talking about the mean. The other two — modes and medians — have their own place but are used a lot more rarely.
The mean is often represented by the Greek letter μ. It’s used in a large number of trading calculations and can be calculated manually, using an app, or via a simple Excel formula.
The equation for mean is below:
Mean = ( Σ Xi ) / N
For the above equation, Σ Xi represents the sum of all data points in your set. This number is then divided by N, which is equal to the number of data points in the set.
For example, let’s say you want to figure out your mean purchase price for your Bitcoin portfolio. The prices are:
6, 7, 100, 500, 4564, 3900, 6784, 10600, 5000, 4586 3304
To find the mean we add them all up and then divide by the number of purchases.
(6 + 7 + 100 + 500 + 4564 + 3900 + 6784 + 10600 + 5000 + 4586 + 3304) ÷ 11 = 3,577.36
The median is the middle number from this set listed from smallest to biggest.
6, 7, 100, 500, 3304, 3900, 4564, 4586, 5000, 6784, 10600 = Median = 4564
The range is found by subtracting the smallest number from the largest.
10600–6 = 100594
Plotting averages are a great way to visually represent changes in the price of a cryptocurrency. The most basic way is using a Simple Moving Average (SMA). To calculate the SMA take the previous X number of period closing prices, add them together and divide by X.
So if you were looking at a daily chart and using a 9 period SMA, you would take the closing prices for the past 9 days and take the average of them. An example is provided in the chart below.
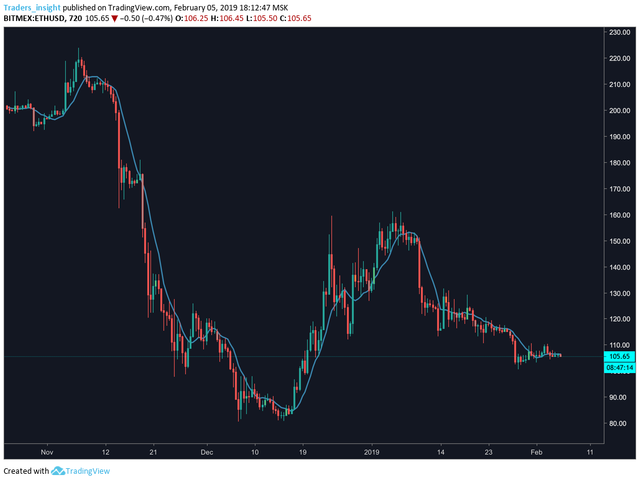
It’s hard to tell what exactly is going on with the 9 SMA, It sticks closely to current prices and there is not usually any significant deviations away from the current price. The 9 period is good for tracking what the recent average for price was, but it moves very fast and tracks closely.
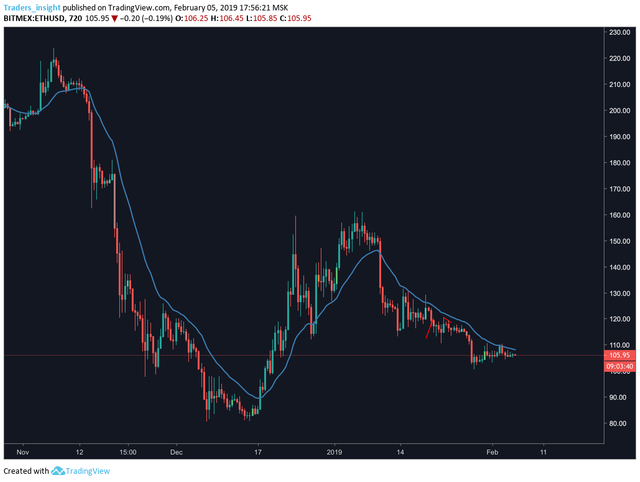
By increasing the period of the Moving Average, the smoother the line will become and will not experience major shifts simply based on one day’s worth of information. In the chart below a 21 period EMA is shown. Price rarely crosses the EMA, allowing for the creation of trading strategies based on price movement in relation to the EMA.
A simple strategy that you could implement would be to buy when price closes above the 21 period EMA and short it when it closes below. Applying that logic to the chart above would create the following buy and sell signals.
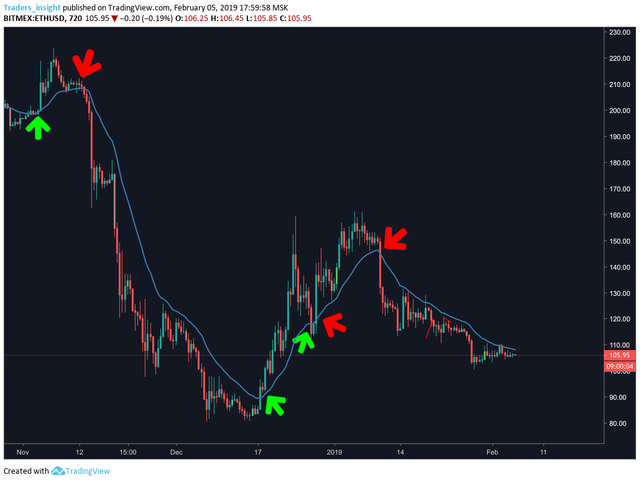
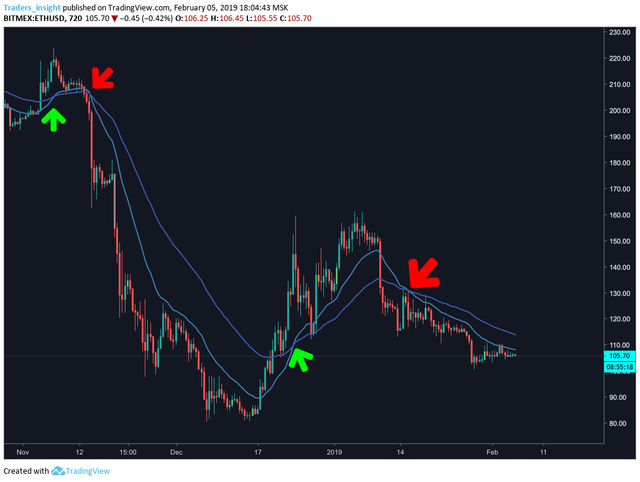
This type of strategy is a good start, but its subject to a lot of choppiness. Another option, is to add a second moving average, in this case a slower 50 period MA, to help remove the choppiness inherent in using such a fast indicator. Now, instead of using closing price as the trigger for entry, a trade would be entered when the faster indicator crosses the slower indicator, as seen in the example below.
Different setups are better for different markets. In order to maximize your return potential, backtest many different variants over various time periods to determine the optimal strategy. Changing the parameters of your Moving Averages can have significant effects on the realized returns. It’s extremely important to backtest every change and then choose the one with the best past results to try out in real markets.
In the next part, we will introduce Standard Deviation. This powerful concept is used in all markets as a way of measuring volatility and can be used to determine the expected move of an asset.
Would you like to learn more about crypto trading? Сheck out our educational platform Adara Academy
Get a free 1-on-1 trading session with our experts! Apply now to be one of the first 50 accepted applicants — Apply to join!
- Talk to us on Telegram — Adara Telegram
- Engage in conversations on Twitter — Adara Twitter
Congratulations @adara-io! You received a personal award!
You can view your badges on your Steem Board and compare to others on the Steem Ranking
Vote for @Steemitboard as a witness to get one more award and increased upvotes!