Bitcoin / US Dollar | BTCUSD Trading Charts | 10/8/18
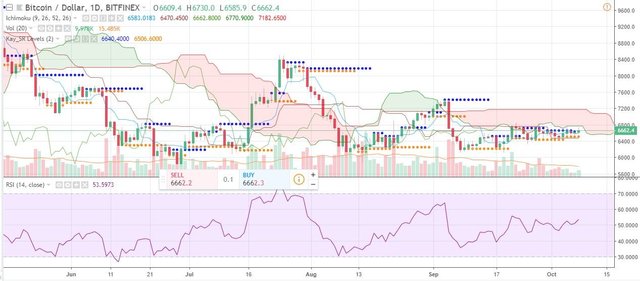
BTC is still going sidelines as it tries to break in the mini-resistance at $6,666, which is immediately followed by another mini-resistance at $6,700. Even if it breaks both marks, it will immediately enter the red kumo (Ichimoku Cloud) while trying to break the psychological resistance of $7,000.
Bitcoin last hit the 7K mark last September 1, 2018.
If BTC fails and continue to fall, support is immediately seen at $6,400 - $6,500 with a final strong support at $6,200. If BTC breaches the $6,200 mark, we might revisit the $5,800 and $5,500 mark. We last visited the $5.8K mark in June 2018.
RSI is still neither overbought or oversold so there's no clear trend at this point other than sideways.
The numbers:
- Immediate Resistances: $6,600 - $6,700
- Immediate Supports: $6,400 - $6,500
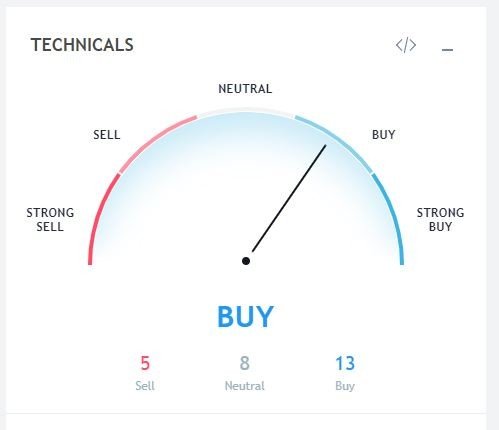
Tradingview Indicators
Caveat:
- Do your own research
- Charts, especially those of the cryptomarkets are so volatile a simple news can change the flow of the trend.