Ripple (XRPUSD & XRPBTC) Strong Breakout - Analysis by Request
 XRP is looking really strong on the daily chart . Wait no, Ripple is looking good across all time frames and pairs ( BTC -6.90% & USD). Let's take a quick look.
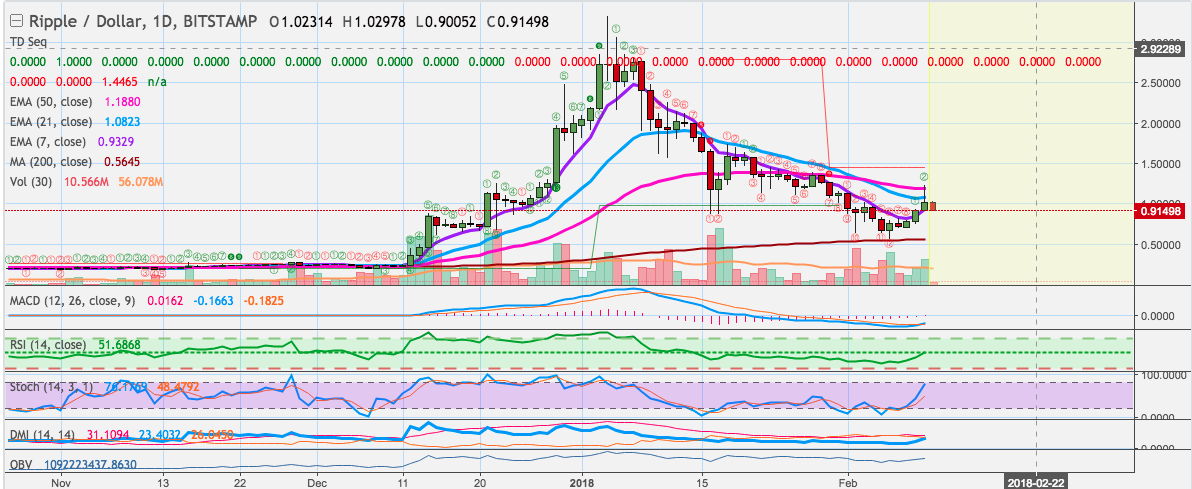
Yesterday we had a strong candle almost full green, today the momentum is keeping up and the up movement remains.
We are sitting at the EMA50 line, which can work as resistance, once this level is broken we can expect additional growth up (magenta line on the chart).
The MACD just crossed over and it is showing plenty of room for growth.
The RSI and DMI are trending upward and showing plenty of room for growth. The STOCH is bullish but in the upper side, might be pointing to a very small retrace, this is not a big signal though. We remain very bullish .
Volume is also good in the last few days of trading, which is a good signal that backs up the rise in price we have been having the last few days.
Note: This is all based on the daily chart .
The short term 1h, 2h and 4h charts are all looking overbought on the RSI but the rest of the indicators are extremely bullish . This can lead to a small retrace or sideways action until the RSI levels out.
There is room for growth on the weekly chart but that part still needs more work, it can go either way.
Overall, Ripple looks good vs USD.
It is moving up strong and all the indicators on the chart short support this movement.
Let's hope that it's going uppp