Bitcoin Misery Index Tells You When To Invest
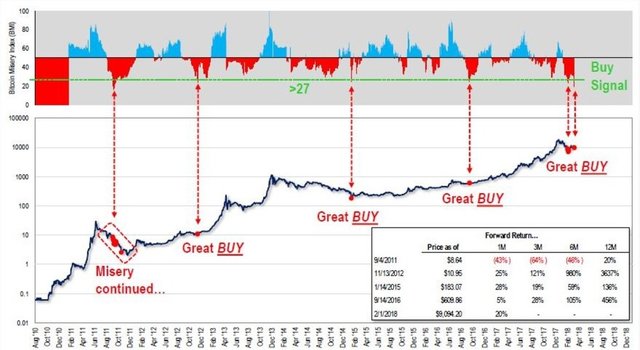
The Bitcoin Misery Index (BMI) has been created by Tom Lee, a famous Bitcoin bull and co-founder of US research firm Fundstrat, to indicate when it would be a good time to make an investment in the most popular digital currency.
During the Bitcoin price slump at the beginning of 2018, the index was at all-time lows, suggesting that it was, and still is, a perfect buying opportunity. Tom Lee has gone even further, predicting that the price of Bitcoin could rise to USD 20 000 in 2018 and reach USD 91 000 by March 2020.
The tool, presented by Lee in March, attracted solid media interest, most probably driven by the fact that Bitcoin’s price dips in early 2018 gave a relatively rare signal to buy. In total, there were only five such perfect buying signals that occurred in the whole nine-year history of the biggest cryptocurrency.
BMI Features
The BMI, which varies from 0 to 100, is based on contrarian economic indicators like market volatility. The all-time low of the index stands at 16.2, reached in September 2011. Lee claims that when the misery index falls below 27, the next 12 months for Bitcoin are expected to be incredible in terms of price performance. A trigger for a buy is when the index falls below 27 and for a sell is when it goes above 67.
The contrarian investment style, on which the BMI is based, focuses on buying assets when most other people are selling and selling them when demand is high and prices are growing. Similarly to the Relative Strength Index (RSI) that is used for stocks, indices, and commodities, the BMI shows conditions of oversold and overbought. However, Lee’s BMI could be a more constructive indicator for oversold for Bitcoin than RSI is, because he has incorporated some additional information into his analysis.
The index is calculated by accounting for the number of winning trades from the total trades (percentage of days that Bitcoin is up), and also measures the volatility (upside less downside). If the index value is low, it suggests that there is pain. It suggests that investors feel very miserable or unhappy to own Bitcoin at the time. According to the contrarian philosophy, when investors are unhappy, you should buy and when investors are happy, you should sell. Hence, the latest low of the index can be explained with the fact that the price of Bitcoin fell from an all-time-high of USD 19 666 in December 2017 to as low as USD 5920.72 in February 2018. This made investors doubt in the market and question themselves whether cryptocurrencies are just a bubble.
The beginning of 2018 was tough for Bitcoin investors. Japan’s largest exchange Coincheck was hacked, the US Security and Exchange Commission (SEC) started investigating a number of initial coin offerings (ICOs), and the trustee dealing with the funds from the defunct Japanese Mt. Gox exchange sold about USD 400 million worth of Bitcoins, pressing the price with oversupply. Additionally, social media giants, including Facebook and Google, banned crypto-related advertising.
A key point to make about the BMI, however, is that it is a technical indicator and should not be taken with 100% certainty. All technical indicators are not free from fallibility. Past performance is not indicative of future results.
(The views and opinions expressed by the contributor in this text should not be considered financial advice,
neither treated as an expression of Coins.Online’s view.
Cryptocurrency trading and investing is risky and market participants are advised to always conduct a thorough research.)
Read more: https://coins.online/cryptocurrency-news/

