Yarr's Corner: The Bitcoin Chart Whales Don't Want You to See
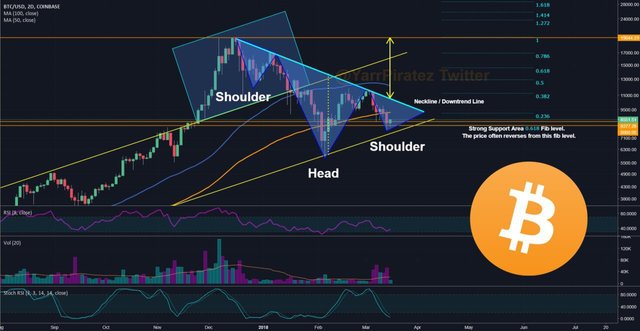
The 2 day chart is showing an inverse head and shoulders pattern. Final shoulder isn't finished yet but a bullish hammer is indicating for reversal.
To see further upward movement the price needs to break above of MA100 level (orange line) and by breaking neckline would give enough of confirmation of trend reversal. 1. Also validity of breakout should be confirmed with large spike in volume. Otherwise breakout will lack of reliance. Volume is an essential part to confirm breakout. Without an expansion of volume, the breakout will lack confidence and be more vulnerable to fail.
The price bounced from the strong support area formed by 8.377 level and fib 0.618. Note that the price tends to reverse very often from 0.618 level.
Disclaimer:
This is not financial advice. Please be aware I am providing this trading information for your benefit and insight to my trading strategies. You are responsible for your trading and investing decisions. It is highly recommended to do your own research before investing anything.

Please, if any question comes to your mind don't hesitate to ask! I try my best to respond ASAP! :)
If you need help with trading, finding information or courses let me know and I'd be more than happy to help you!
More of Yarr
Yarr's Beginners Guide: How to use Moving Averages to Day Trade
Twitter - http://twitter.com/YarrPiratez
Telegram - http://t.me/YarrPiratez
Trading View - http://tradingview.com/u/Yarr
Donations:
LTC - LZUDfi91HEoL589gwBXRQ9WfrFnGYNnot5